This post describes how FITEBOX was born, how it works, and how you can build one yourself. I wrote it as a complete guide so anyone running community events can understand both the journey and the result. FITEBOX was not a straight project: it started with failures, dead hardware, lost recordings, and a lot of stubbornness. What you see here is the outcome of that process.
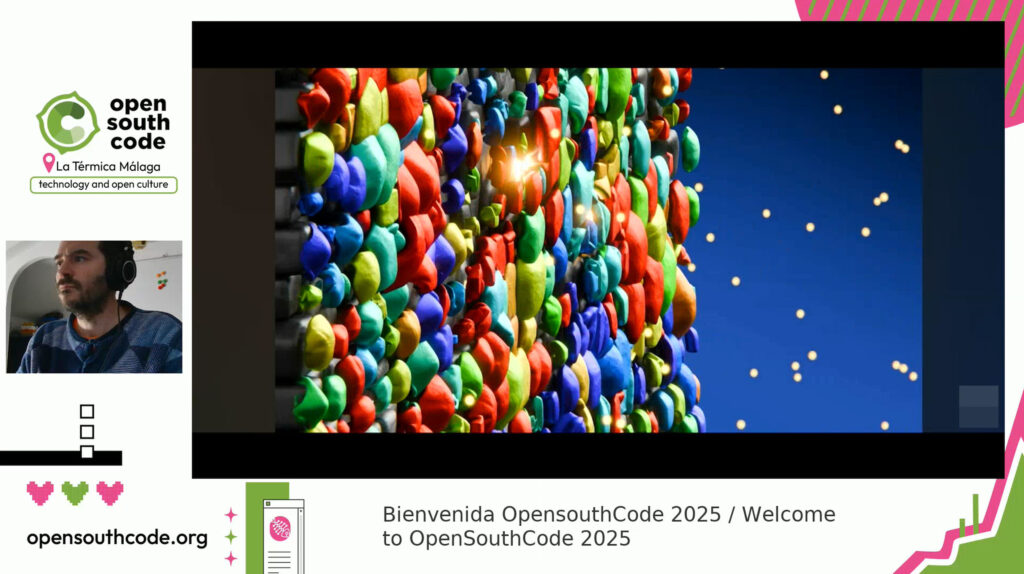
In my experience working with OpenSouthCode (an annual Open Source conference in Málaga, Spain), I learned that recording conference talks should not cost 40% of your event budget. FITEBOX is my answer to that problem: a Raspberry Pi 5 box that records talks autonomously, composite video with slides and speaker camera, mixed audio, branded overlays, and optional live streaming, all managed from a tiny OLED screen or a web UI on your phone.
One box per room. A volunteer plugs it in. No dedicated operator needed.
OpenSouthCode is a community conference. We are a non-profit association with no steady income. We depend entirely on sponsors who support us each year. For years, we hired professional recording crews to capture the talks across multiple rooms. The cost was high. At its peak, video recording consumed nearly 40% of the total event budget. That is money that should go to catering, venue, and making the conference better for attendees. It was unsustainable.
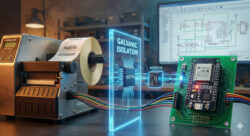
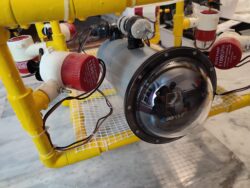
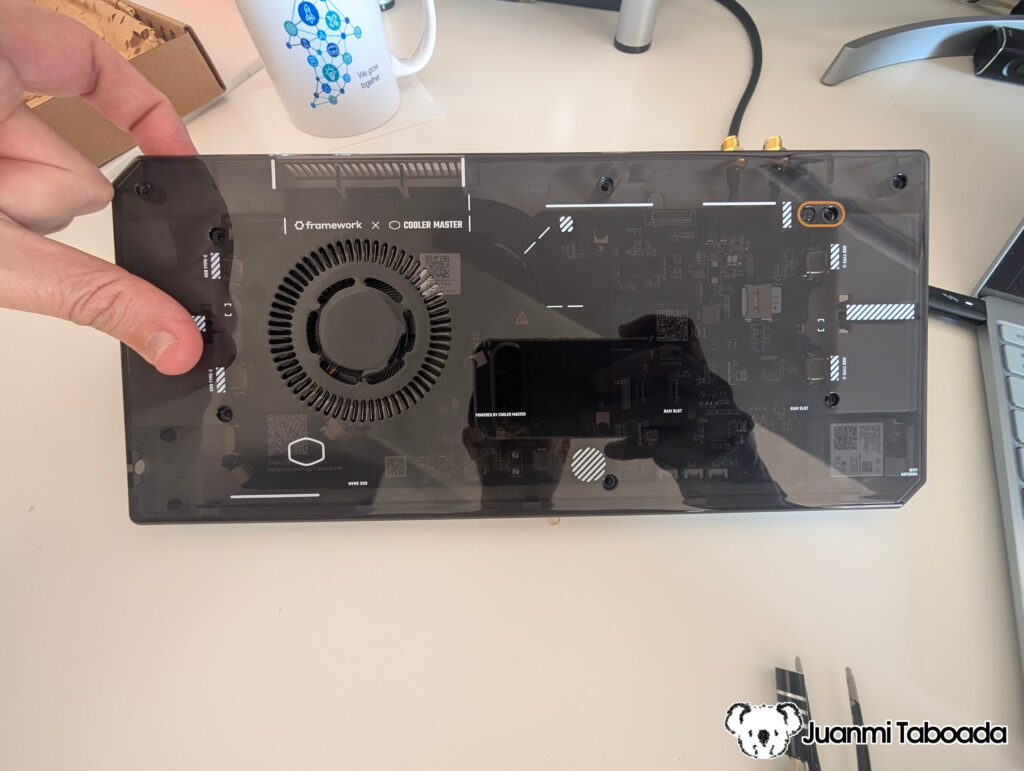
In 2025, David Santos and I decided to fix this. David had the vision for the hardware: a small box based on a Raspberry Pi 5 with an OLED display and physical buttons, capable of autonomously recording a conference room. He designed the hardware architecture, selected the components (the SSD1306 OLED, the GPIO buttons, and the capture card, which was the same one used at FOSDEM conferences), and built the first physical prototype, including the 3D-printed enclosure. The hardware foundation of FITEBOX is the result of David’s work.
We both started with FFmpeg because it seemed like the natural choice. When FFmpeg didn’t perform as expected, we both moved to OBS. David saw that OBS gave better results.
Here is where things went sideways. 🙃
What neither of us knew at the time was that the Raspberry Pi 5 has no hardware H.264 encoder. The Pi 4 had v4l2m2m (a hardware encoding path). But the Pi 5 dropped it entirely; it kept only the decoder.
On top of that, we used cheap Chinese microphones that had a reputation we didn’t know about: they tend to fail after 30 minutes of continuous use. During the event, mics started dying mid-talk.
I handed my FITEBOX unit to a volunteer who was managing the recording. But there was no user interface of any kind, no web panel, no OLED menus, nothing. It was all experimental. The volunteer struggled to control the hardware, and when things went wrong, there was no feedback from the system to explain what was happening.
In my FITEBOX, I developed a system that copied OBS screen templates at startup so we could choose between schemas, but I didn’t prevent misconfigurations due to hardware changes. OBS in my FITEBOX silently misconfigured itself on the first day. It wouldn’t warn about profile mismatches or recording failures. Talks were “recorded”, but the files showed either black screens (because of a laptop resolution mismatch and the webcam cover on) or a full template misconfiguration (videos positioned where they are not supposed to be).
This is how we expected them all to look:
We found some of the recordings dismantled like this:
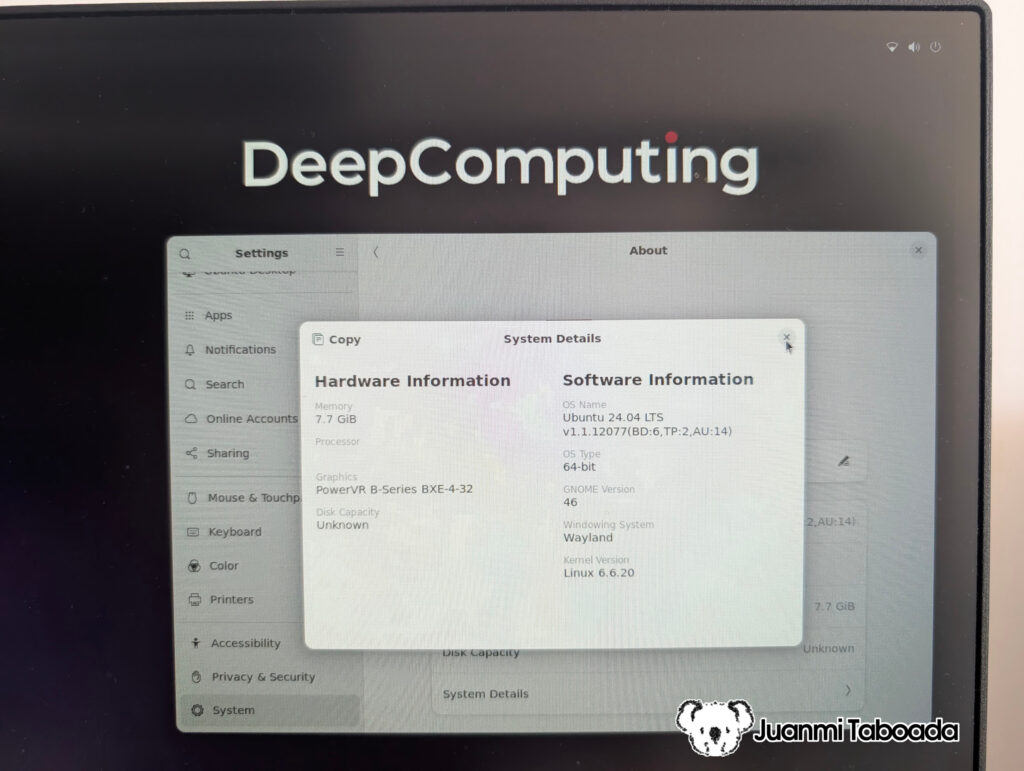
We also spent time investigating RISC-V boards donated to the association, with the aim of using them for the recording infrastructure. That turned out to be a dead end for this particular use case because they arrived too late to the party 🎉 and we didn’t have enough time to prepare a working version.
The result of OpenSouthCode 2025: we lost nearly half of the recorded talks.
I was frustrated but stubborn. I knew the Raspberry Pi 5 had enough CPU power to do this with FFmpeg; it just needed the right software approach and some love. A few weeks ago, I started digging into the actual performance of FFmpeg on the Pi 5 with the help of Claude AI and Gemini as a pair-programming partner. That is when I discovered the missing hardware encoder, and also that there were several other things to tune: PCIe bus generation (Gen3 for the NVMe), USB buffer management, ALSA audio timing, and many more things that are invisible until you actually measure them.
I recovered my motivation and went deep. Weeks of development followed 36 versions of the recording engine, many manual tests on real hardware, and a complete web interface with real-time monitoring. FITEBOX grew from a rough experiment into a professional-grade recording and streaming system.
This post is the full story of how it works. 😎
2. What You Get – The Final Result
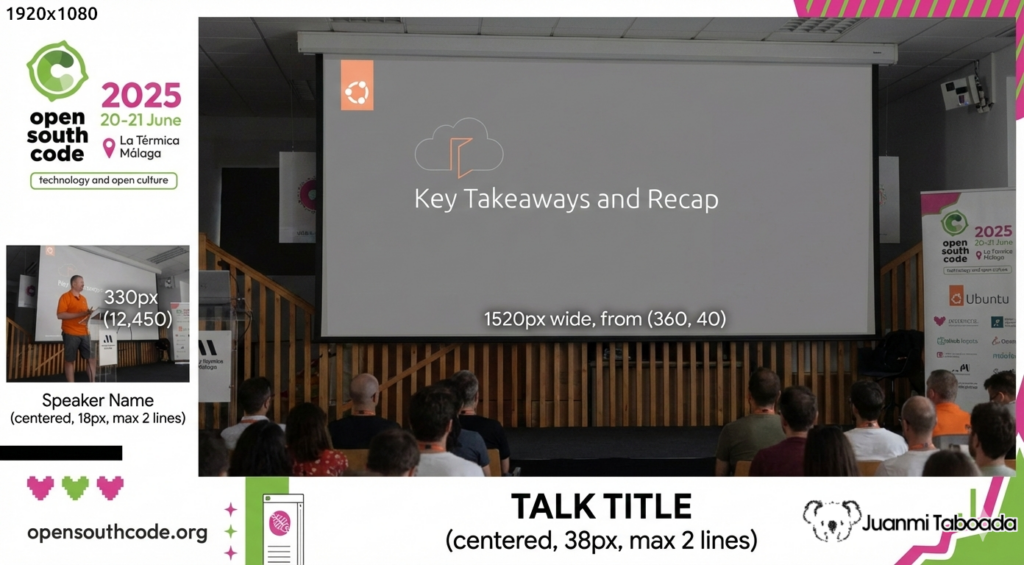
Before we get into the build process, let me show you what a fully configured FITEBOX produces. I think it is important to see the destination before starting the journey.
The recording output is a 1920×1080 composite video with:
The presenter’s screen (captured via HDMI) as the main image area
The speaker’s camera (USB webcam) has a picture-in-picture window
A branded background PNG with your conference’s logo and colours
Text overlays with the speaker’s name and talk title
Mixed audio from the room microphone and the presenter’s laptop (HDMI audio)
The file is written as an MKV (Matroska) file, which is crash-resistant if power fails; everything recorded up to that point is recoverable.
3. Hardware – The Shopping List
Here is the Bill of Materials with the actual prices I paid. Every link goes to the exact product.
Yes, the full production setup is more than the initial 200€ dream. Once you want clean panel-mount connections, a decent webcam, a wireless microphone that doesn’t die after 30 minutes (we learned that lesson at OpenSouthCode 2025), and a proper USB audio interface to connect it, the cost per box reaches 400-550€. Still a fraction of hiring a professional crew at 2.000-5.000€ + per event, and you keep the equipment forever, plus a valuable contribution to OpenSource.
Why these specific parts?
Why NVMe via PCIe HAT instead of USB SSD? The Raspberry Pi 5 has a PCIe lane that supports Gen 3 speeds. An NVMe SSD connected via a PCIe HAT delivers much higher throughput than USB 3.0 and, critically, does not compete with the capture card and webcam for USB bus bandwidth. The setup.sh script enables PCIe Gen 3 with dtparam=pciex1_gen=3 in the firmware config. A 500GB NVMe gives you roughly 500 hours of recording at ~1 GB/hour.
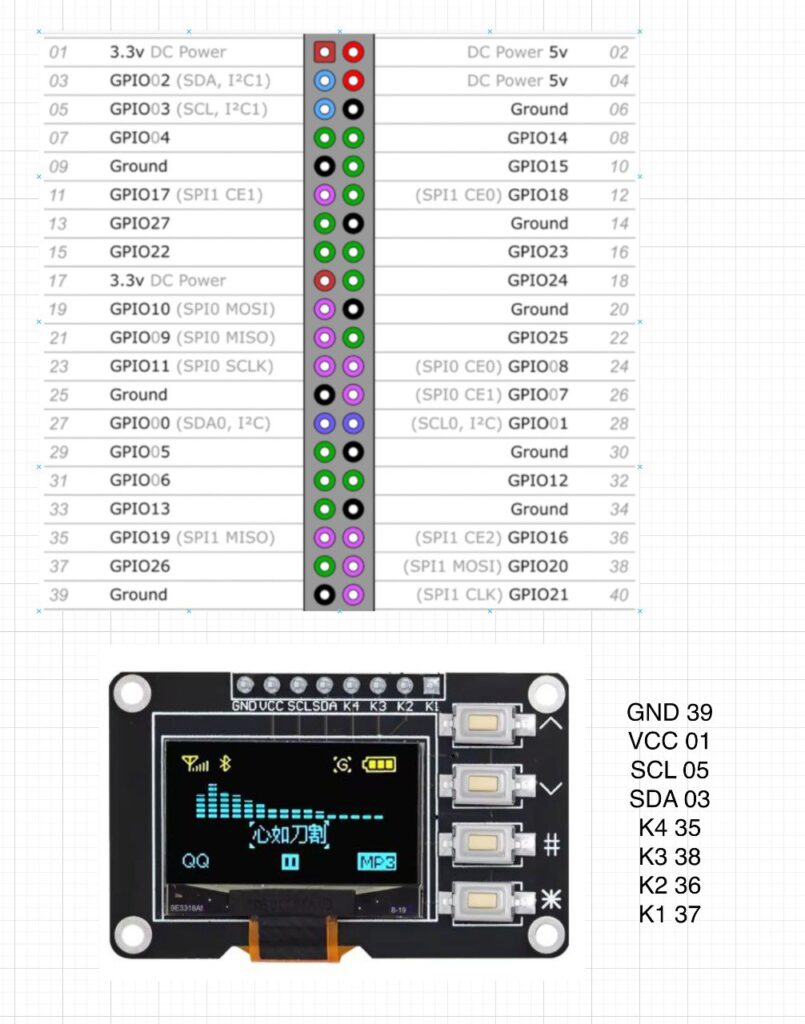
Why the OLED module with integrated keys? This is an elegant find: a single PCB that combines the SSD1315 OLED display (128×64, I2C) with 4 tactile buttons, all soldered to the board. One module, one cutout in the case, one clean panel. The buttons connect to GPIO pins (BCM 26, 16, 20, 19) and the display connects via I2C (SDA/SCL). The whole thing costs 2,22€.
Why the HDMI capture card with loop out? Because it uses a chipset that outputs MJPEG (not raw YUV) over USB. MJPEG is much lower bandwidth, which matters when you have two video devices and a sound card sharing the USB bus. Loop-out (HDMI passthrough) means the presenter’s laptop continues to feed the projector, with no splitter required.
Why the official RPi5 power supply? The Raspberry Pi 5 needs a stable 5V at 5A. Cheap USB-C adapters cause voltage drops under load → CPU throttling (encoding speed drops below real-time), USB device disconnects (your capture card vanishes mid-recording), and data corruption. I lost several test recordings before switching to the official PSU. Do not cheap out on the power supply.
Why a wireless mic + USB audio interface? Because cheap wireless USB microphones die. We learned this at OpenSouthCode 2025 when multiple mics failed after 30 minutes of continuous use. The Godox MoveLink M2 is a professional 2.4GHz wireless system that clips to the speaker’s collar. Its receiver outputs analogue audio, so you need a USB audio interface (the Behringer UCA222) to get the signal into the Pi. FITEBOX’s detect_audio.sh auto-classifies the Behringer as a sound_card and gives it top priority over webcam audio.
Why panel-mount cables? Because all external connections (USB-C power, HDMI in/out, USB for webcam and mic) should be accessible on the outside of the case with screw-secured connectors, while the internal wiring stays clean and stable. This is what separates a production appliance from a prototype.
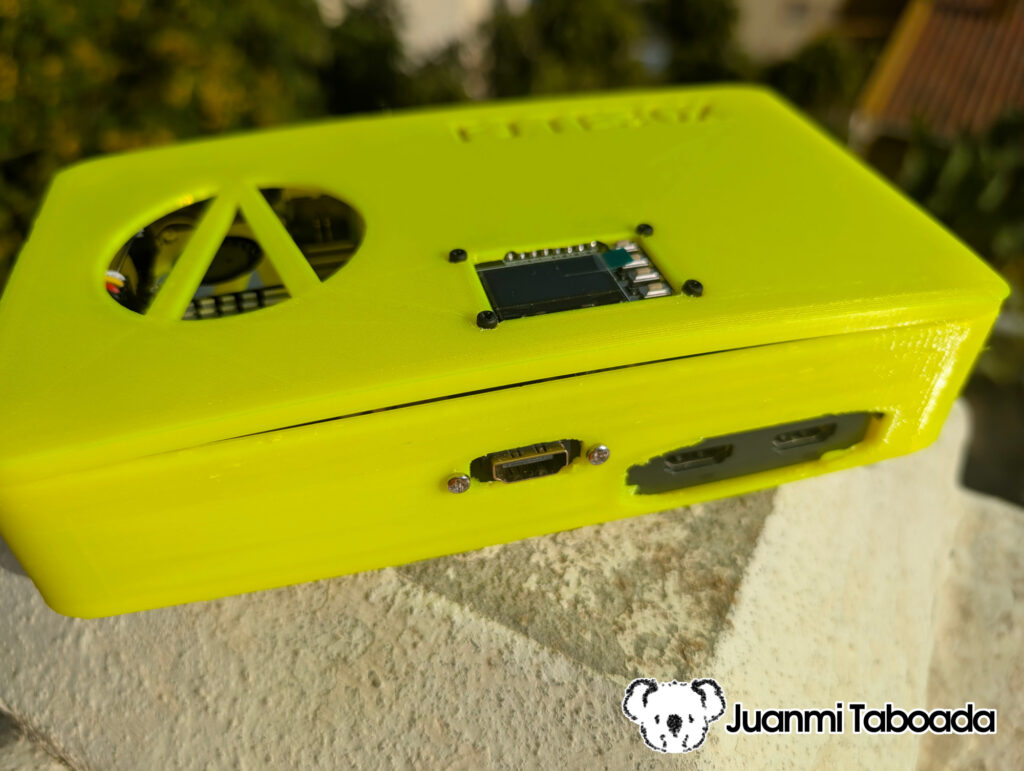
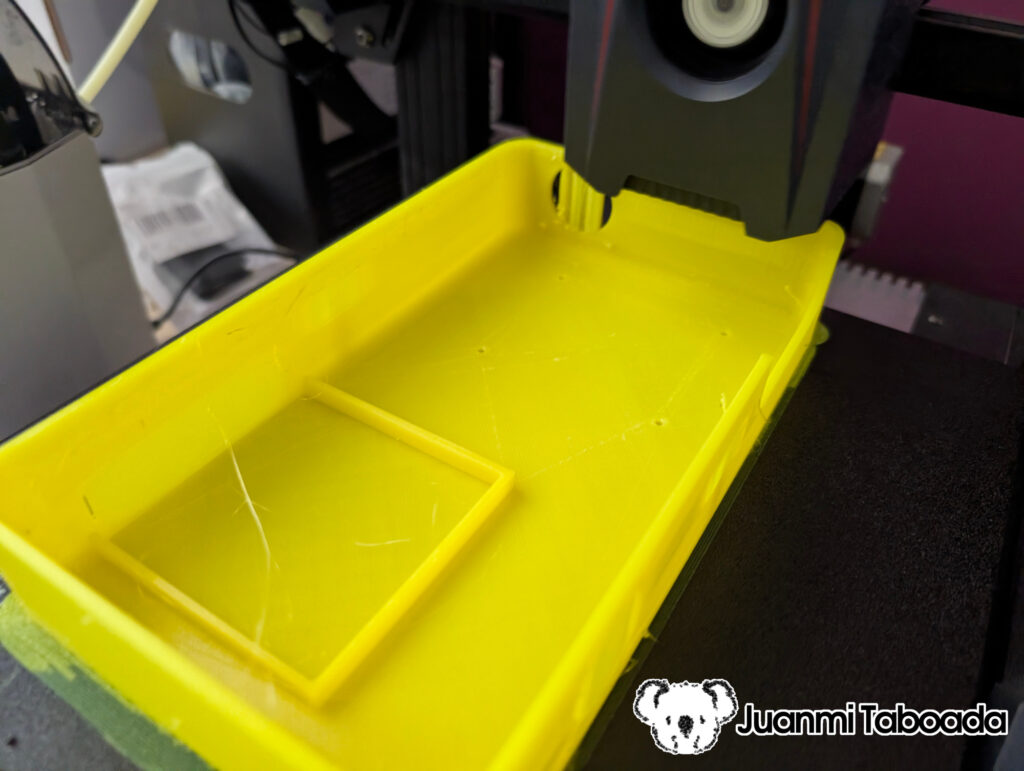
4. The Enclosure – 3D Printing and Assembly
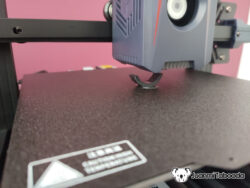
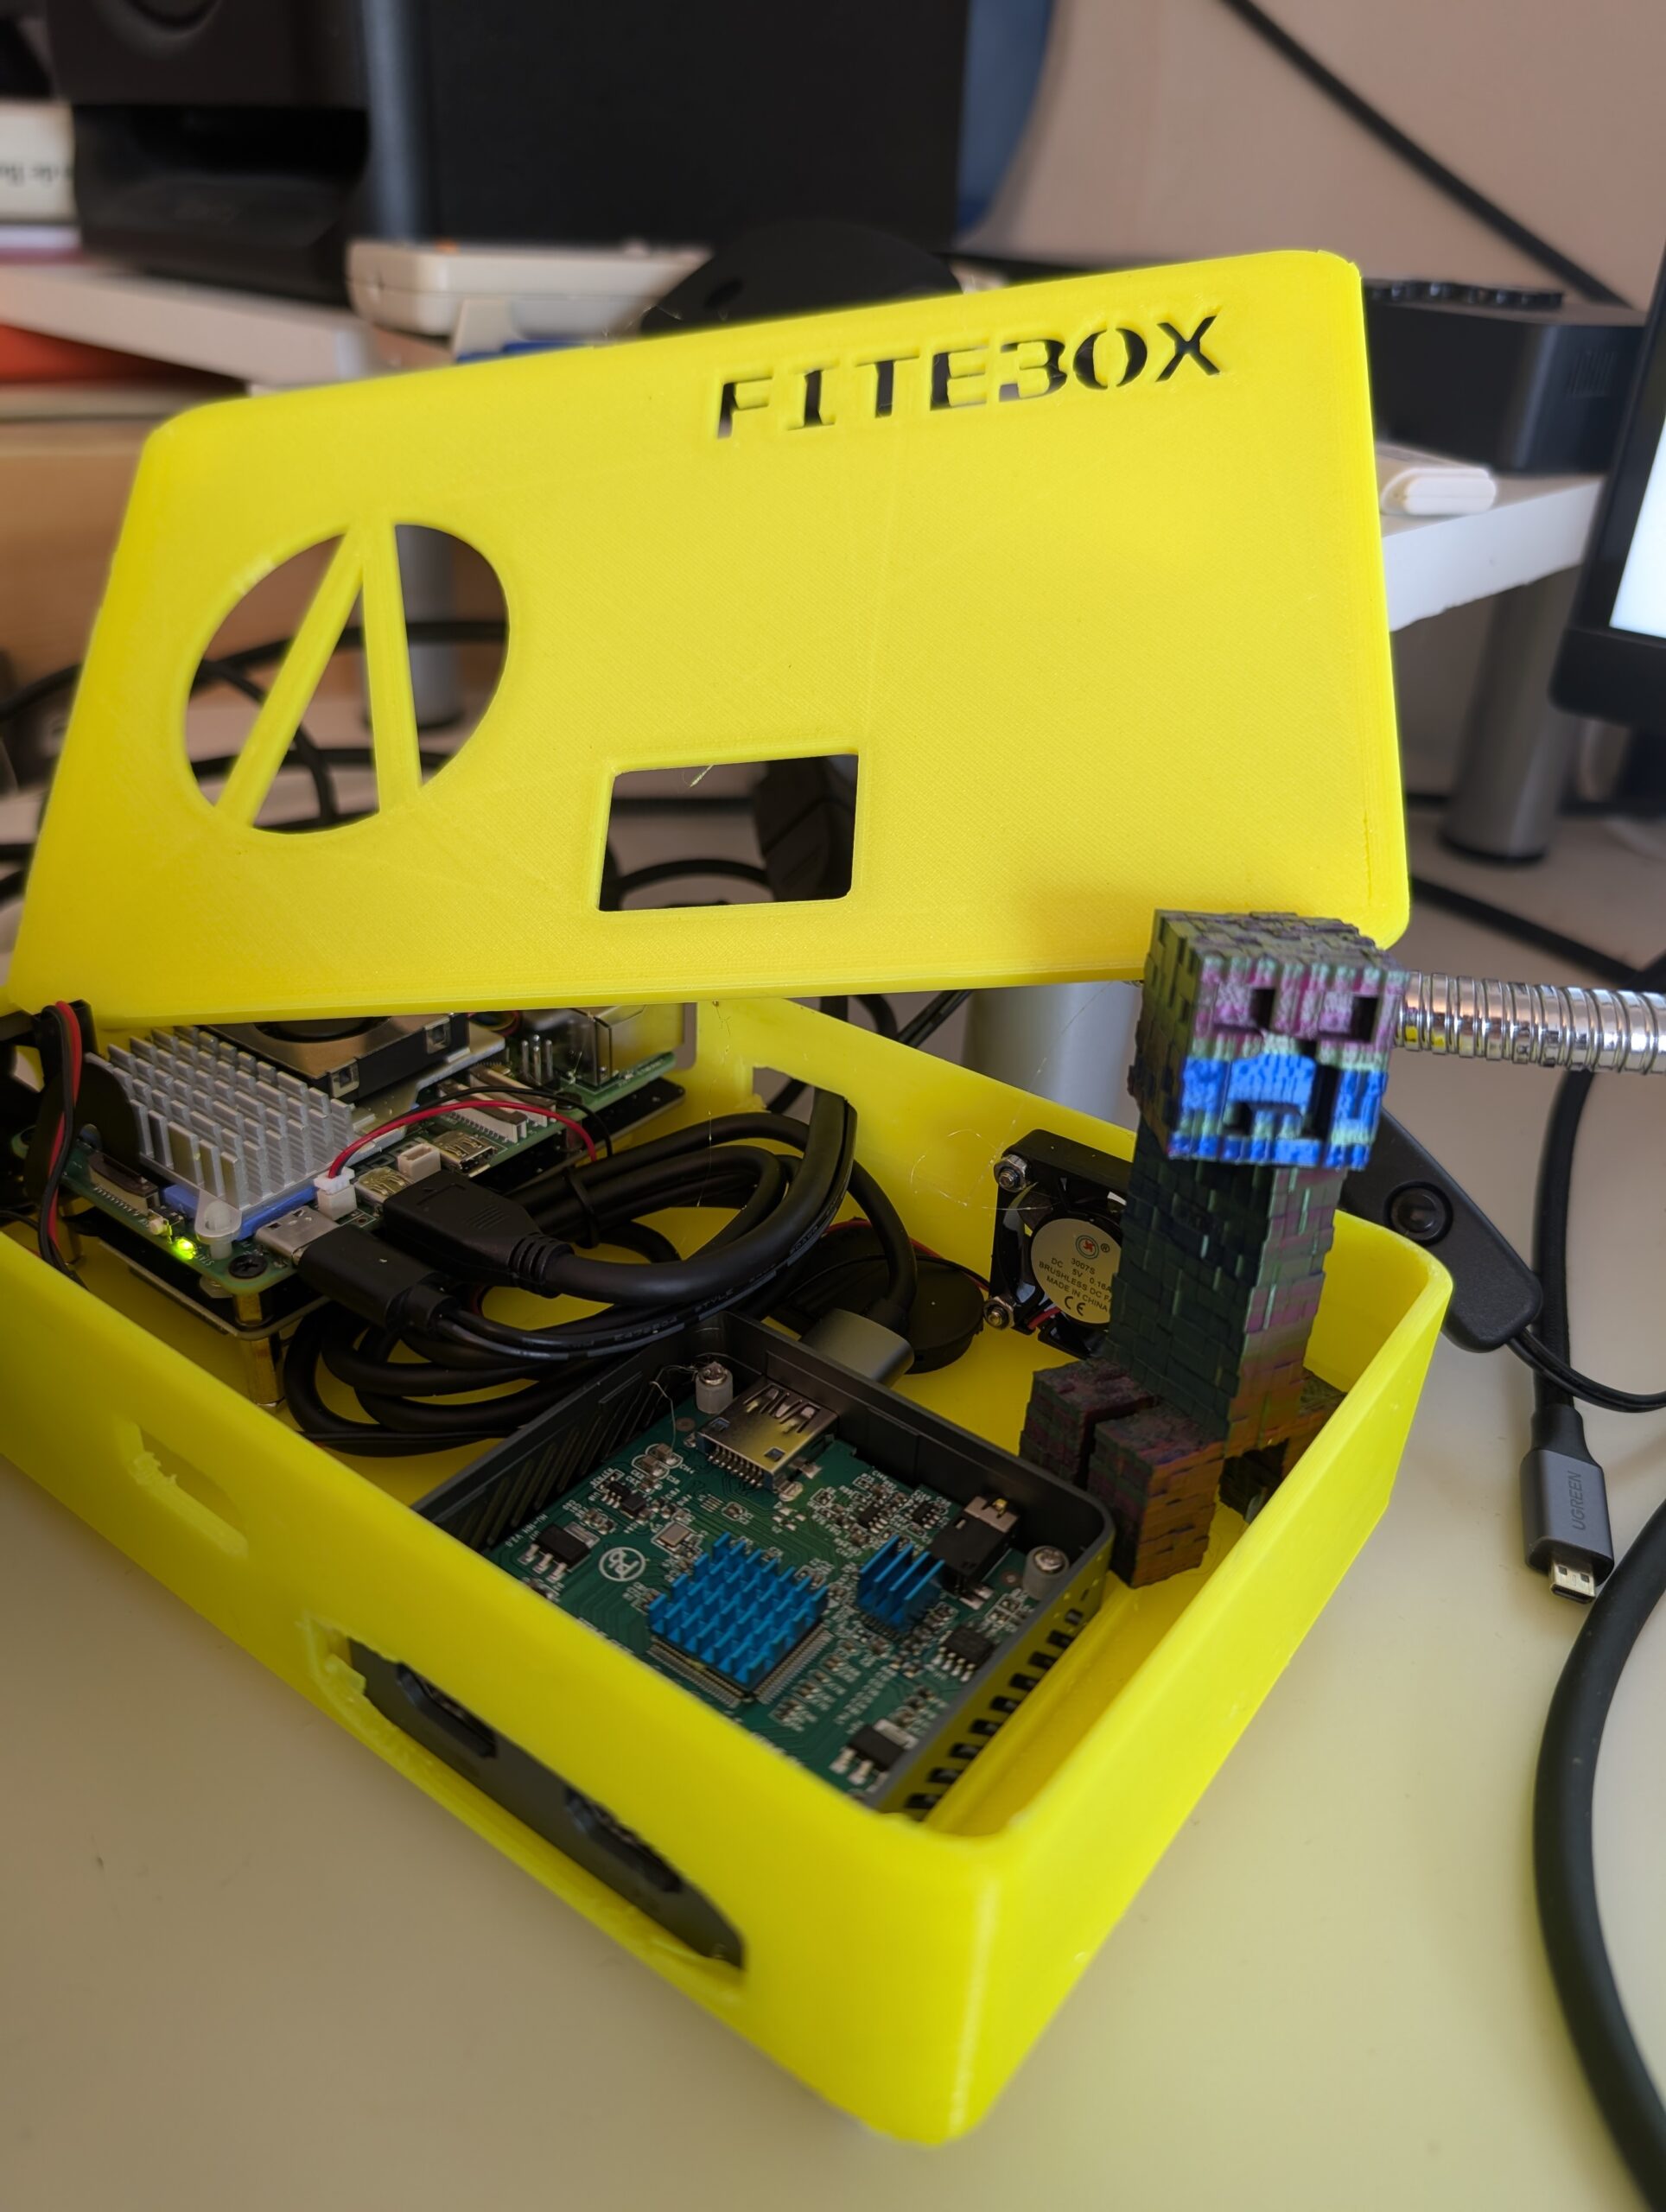
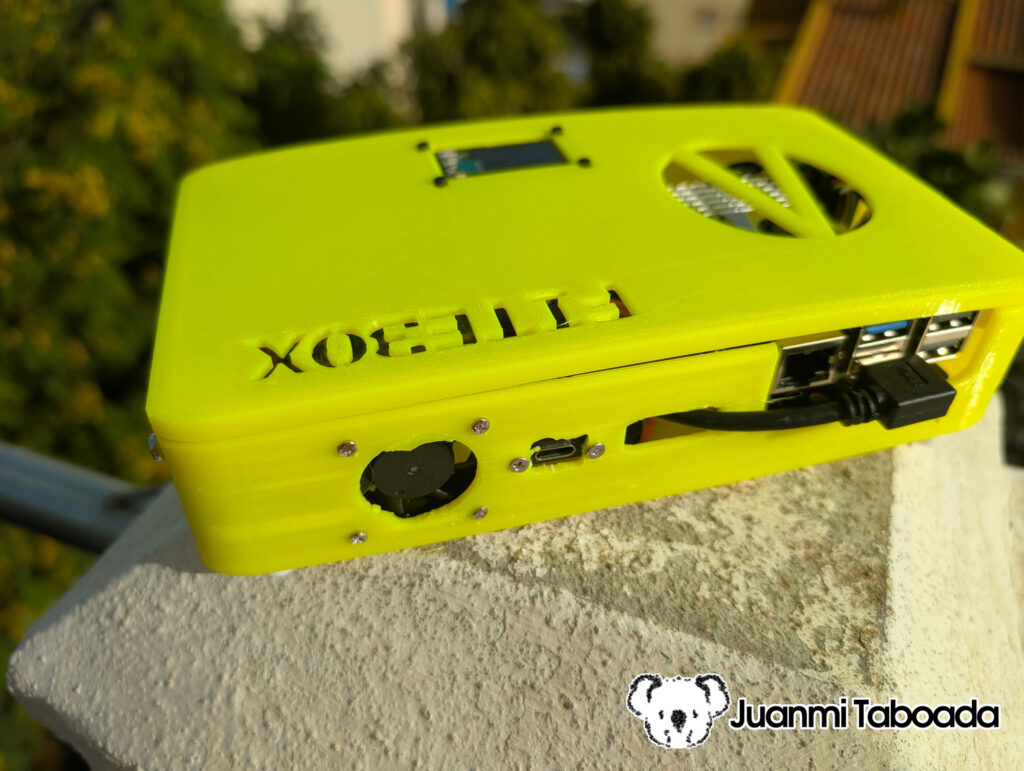
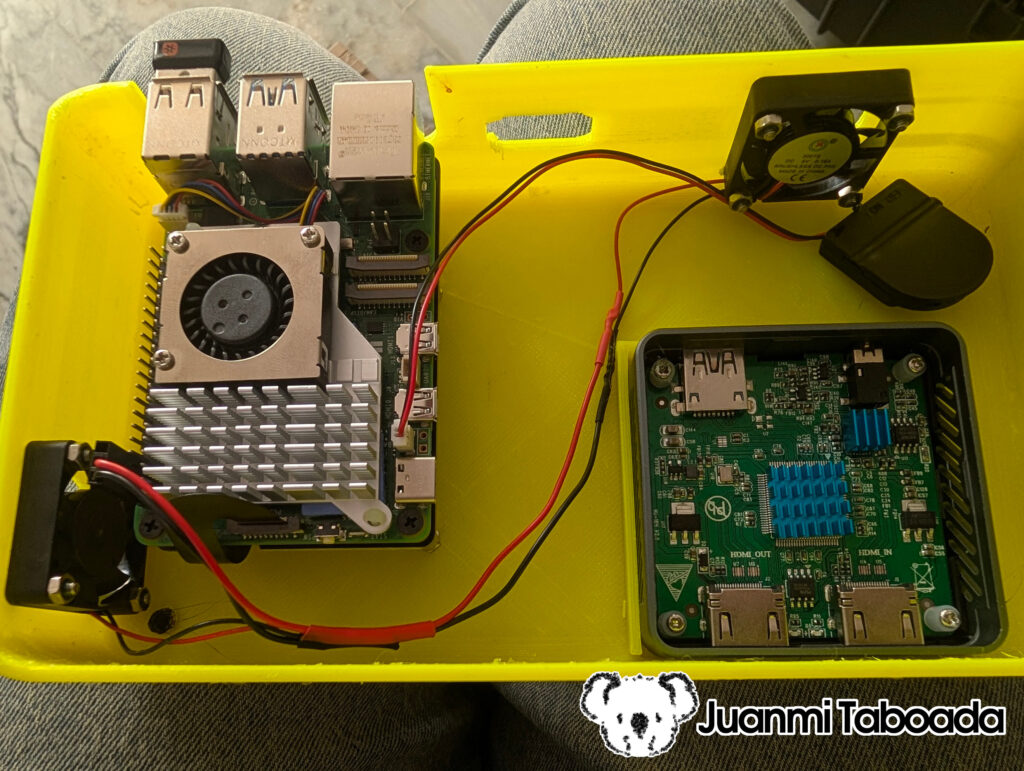
David Santos designed the FITEBOX enclosure, and we printed it on our 3D printers. The STL files are included in the repository. The design has some notable features that are visible in the photos:
Two-compartment layout: the Raspberry Pi 5 occupies the main compartment, and the HDMI capture card sits in its own sub-enclosure with a heatsink and ventilation slots. This keeps the capture card thermally isolated and mechanically secure.
Dual 30mm exhaust fans are mounted on opposite corners of the case for cross-ventilation. The Pi 5 runs at near 100% CPU during recording – thermal management is not optional.
Top-panel cutout for the OLED+buttons module – one clean rectangular opening, four screws, done.
Panel-mount cable ports on the edges for USB-C power, HDMI in/out, and USB devices. All connections are screw-secured and accessible without opening the case.
Bright yellow PETG – easy to spot in a conference room, hard to accidentally leave behind.
We chose a clean, permanent build philosophy. No breadboards, no flying Dupont wires, no tape. This is equipment that a volunteer will handle at a real event, and it must work reliably. If something comes loose during the conference, you lose all recordings for that room for the rest of the day.
5. Mounting the Hardware Step by Step
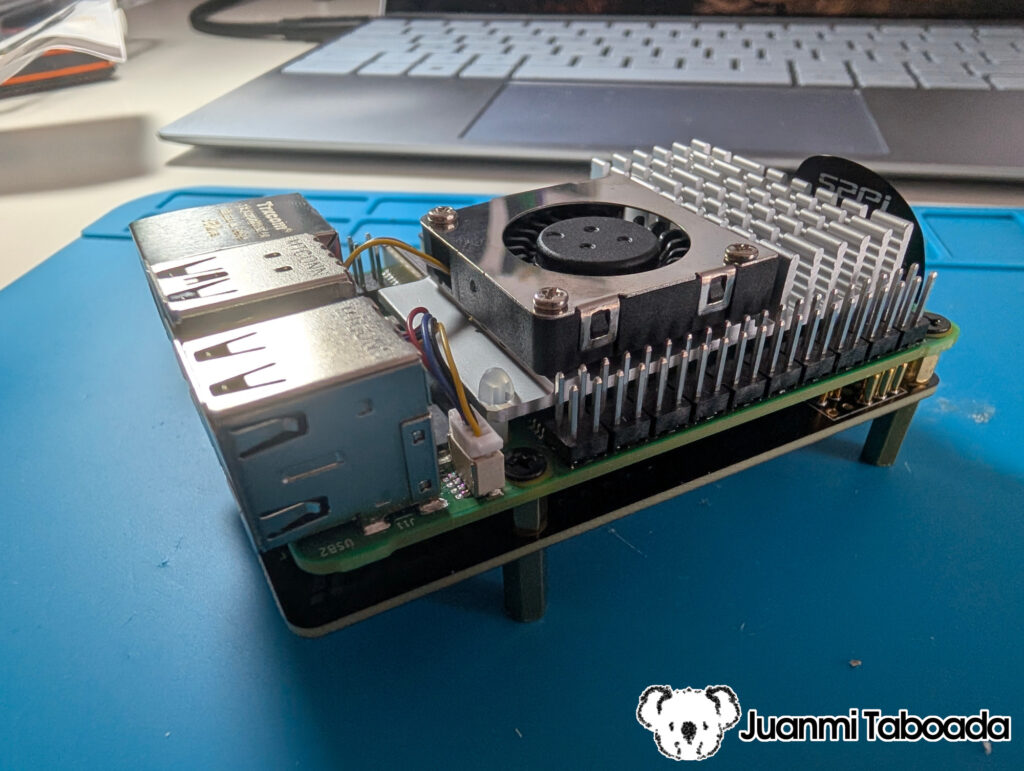
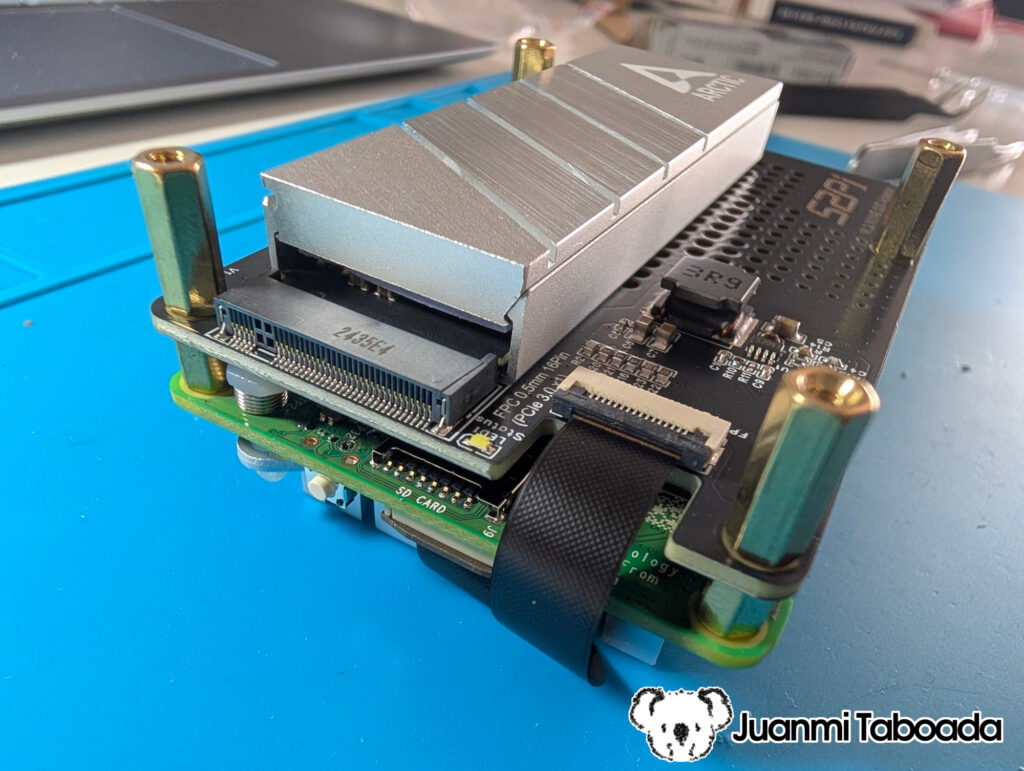
Step 1: Assemble the RPi5 + NVMe Stack
This is the core of the build. The Raspberry Pi 5 sits at the top, with the PCIe NVMe HAT mounted under via brass standoffs, connected to the Pi’s PCIe connector via an FPC ribbon cable. The NVMe SSD slots into the HAT, and the ARCTIC M2 Pro heatsink goes on top of the SSD.
Apply thermal paste (usually included with the heatsink) between the SSD and its heatsink. Install the active cooler fan on the Pi 5’s CPU. The result is a compact two-board stack.
Secure this stack to the base of the enclosure.
Step 2: Install the Exhaust Fans
Mount the two 30×30mm fans in the case’s designated ventilation areas. These are powered by the Pi’s 5V/GND GPIO pins (or a fan header if available). Orient them to blow outward. The active cooler on the Pi draws in air, and the exhaust fans push it out.
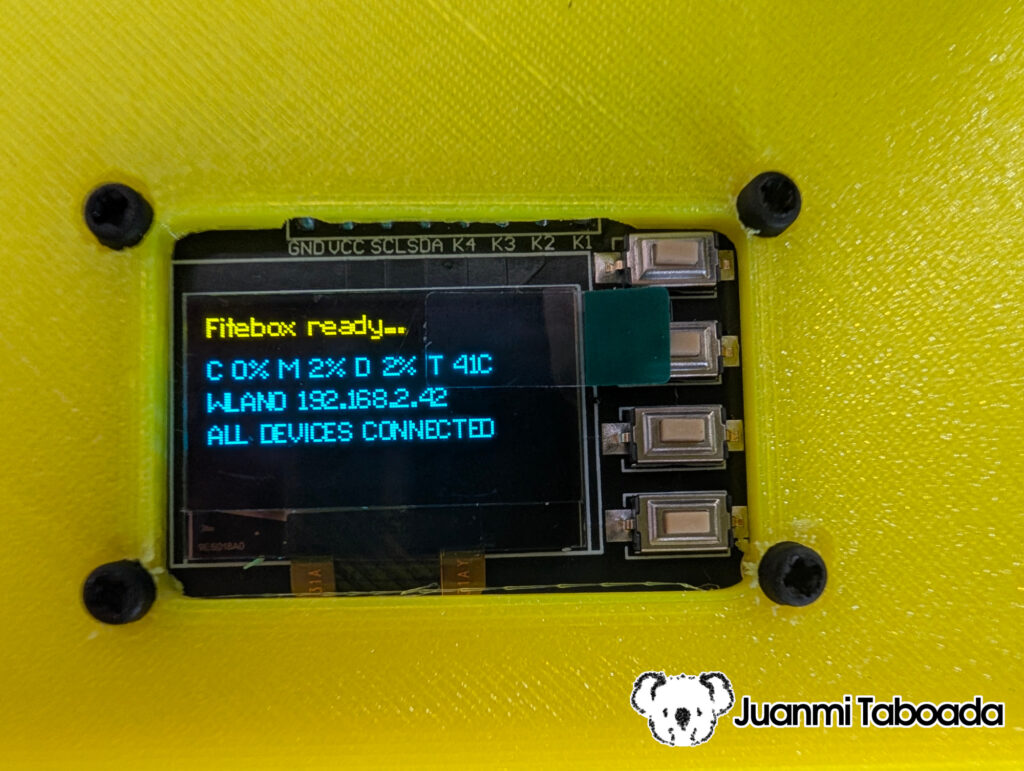
Step 3: Mount the OLED+Buttons Module
FITEBOX uses an integrated module that combines the SSD1315 OLED display (128×64) and 4 tactile buttons on a single PCB. This eliminates the need for separate button wiring; everything runs through a single connector strip.
The module connects to the Pi’s GPIO header with 8 wires (a single ribbon cable):
Module Pin
Raspberry Pi Pin
GPIO
GND
Pin 39
Ground
VCC
Pin 1
3.3V
SCL
Pin 5
GPIO3 (I²C)
SDA
Pin 3
GPIO2 (I²C)
K4 (Select)
Pin 35
GPIO19
K3 (Down)
Pin 38
GPIO20
K2 (Up)
Pin 36
GPIO16
K1 (Back)
Pin 37
GPIO26
The module fits into a single rectangular cutout in the top panel of the case, secured with 4 screws. The buttons face outward and are easily accessible. No external resistors needed – the software uses the Pi’s internal pull-up resistors via gpiod.
Step 4: Install the HDMI Capture Card
The HDMI capture card sits in its own sub-compartment inside the case, in a separate 3D-printed enclosure mounted next to the Raspberry Pi. This keeps it thermally isolated (the capture card has its own heatsink, I got from a Pi kit) and mechanically secure.
Connect the capture card’s USB output to the Pi via an internal short USB 3.0 cable. The HDMI IN and HDMI OUT ports face the edge of the case, where panel-mount HDMI connectors provide clean external access.
Step 5: Connect External Devices
The panel-mount cables provide clean external access. From outside the case:
USB-C power – panel-mount connector to the Pi’s USB-C power input
HDMI IN – micro HDMI panel-mount connector to the capture card input (from presenter’s laptop)
HDMI OUT – from the capture card passthrough to the projector
USB ports – for the webcam, microphone receiver, and Behringer audio interface
The NVMe SSD is internal (connected via the PCIe HAT), so it does not use any USB ports. This frees the USB bus for the capture card, webcam, and audio devices.
Step 6: Close the Case
Route cables neatly, verify the 30mm exhaust fans are connected and oriented correctly (blowing out), and close the enclosure. Verify that the OLED display is visible and all buttons are accessible through the top panel cutout.
6. Software Setup – From Zero to Running
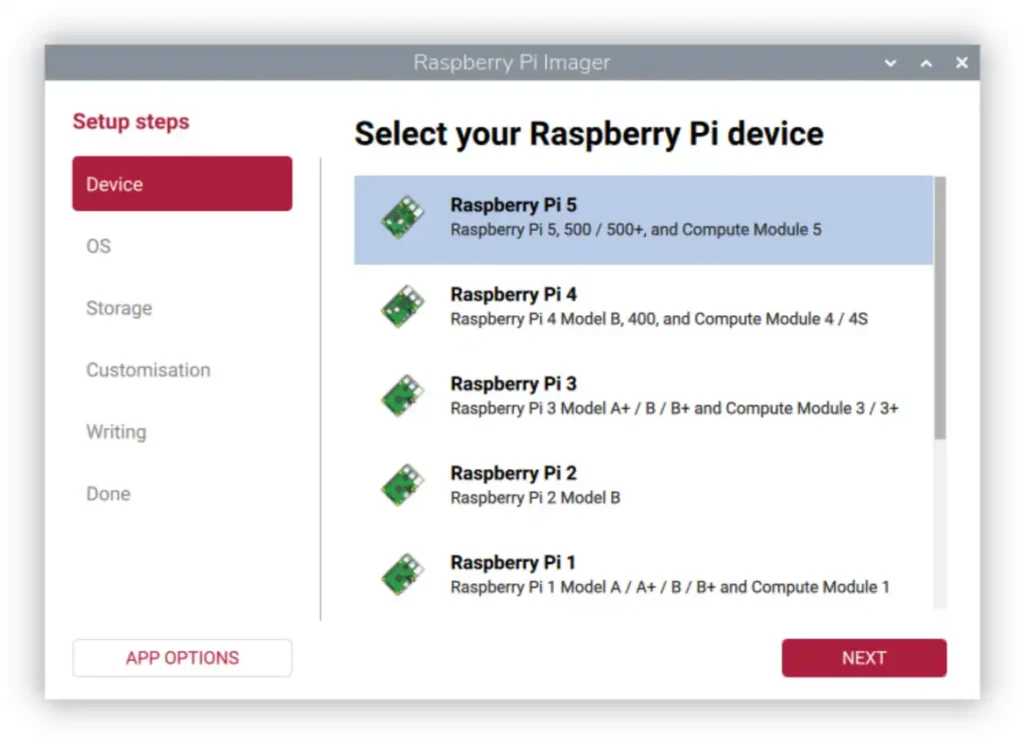
6.1 Flash the OS directly to the NVMe SSD
FITEBOX boots directly from the NVMe SSD; do not use an SD card in production. Connect the NVMe (via USB adapter or the PCIe HAT on another Pi) and flash Raspberry Pi OS Lite (64-bit, Debian 12 Bookworm) to it using Raspberry Pi Imager. Enable SSH and set a hostname like fitebox.
Then boot the Pi with a temporary SD card to set PCIe:
$ sudo raspi-config
# → Advanced Options → PCIe Speed → Yes
#   (Enables the PCIe connector and forces Gen 3.0 speeds)
Set the boot order:
$ sudo raspi-config
# → Advanced Options → Boot Order → B1: SD Card Boot
#   (Boot from SD card if available, otherwise boot from NVMe)
Once configured, remove the SD card and the Pi boots from NVMe. Fast, reliable, and the full 500GB is available for both the OS and recordings on the same drive.
Docker: installs Docker Engine + Compose plugin, adds your user to the docker group
Kills PulseAudio and PipeWire: masks both services system-wide and disables PulseAudio autospawn. This is critical – if PulseAudio is running, FFmpeg cannot access ALSA devices directly
USB buffer tuning: sets usbfs_memory_mb=1000 (The default 16MB is far too small for two video capture devices on the same bus)
Kernel tuning:vm.swappiness=10, dirty ratios down to 5-10%, real-time scheduling enabled, file limits raised to 65536
Cgroups: enables cgroup_enable=memory In the boot command line for Docker memory management
Raspberry Pi 5 specific: enables PCIe Gen 3 (dtparam=pciex1_gen=3 in config.txt) for faster SSD throughput. Sets boot to console autologin
Plymouth: installs the FITEBOX boot splash theme (the logo you see during boot before the OLED starts)
Sudoers: configures passwordless sudo for reboot, shutdown, and Plymouth displays messages
Directories: creates recordings/, log/, run/ with correct ownership and permissions
TLS certificates: generate self-signed certificates for HTTPS
Docker .env: writes your UID/GID so Docker containers create files owned by your user, not root
A reboot is required after setup to apply kernel parameters and PCIe changes. The script tells you this at the end with appropriate urgency. You can relaunch the script several times; it is safe to reuse.
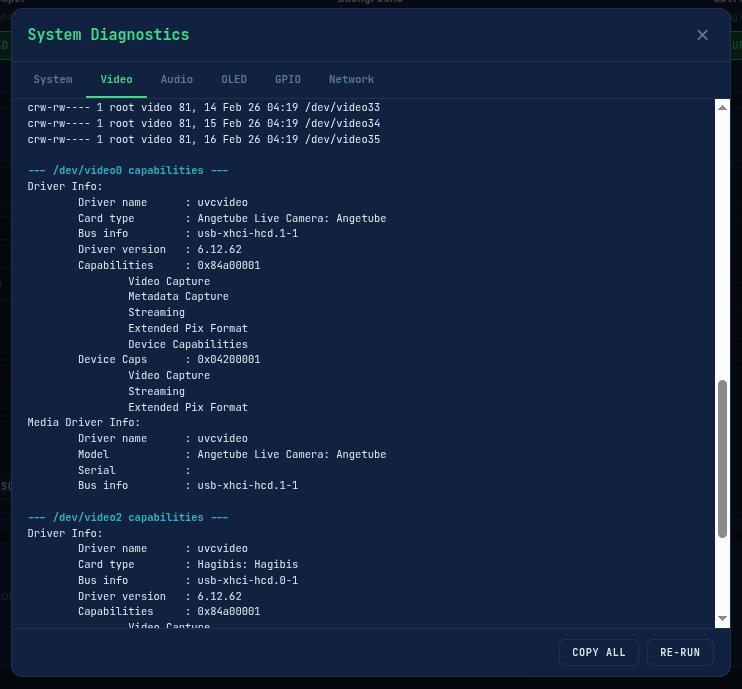
6.5 Run Diagnostics
Before building the Docker container, run the diagnostic tools to verify that all hardware is detected and working. FITEBOX includes a full suite of detection scripts:
# Full system diagnostic - generates a timestamped report
./diagnostics.sh

# Audio device detection and classification
./detect_audio.sh

# OLED display detection and visual test
./detect_oled.sh

# GPIO button wiring test
python3 detect_buttons.py
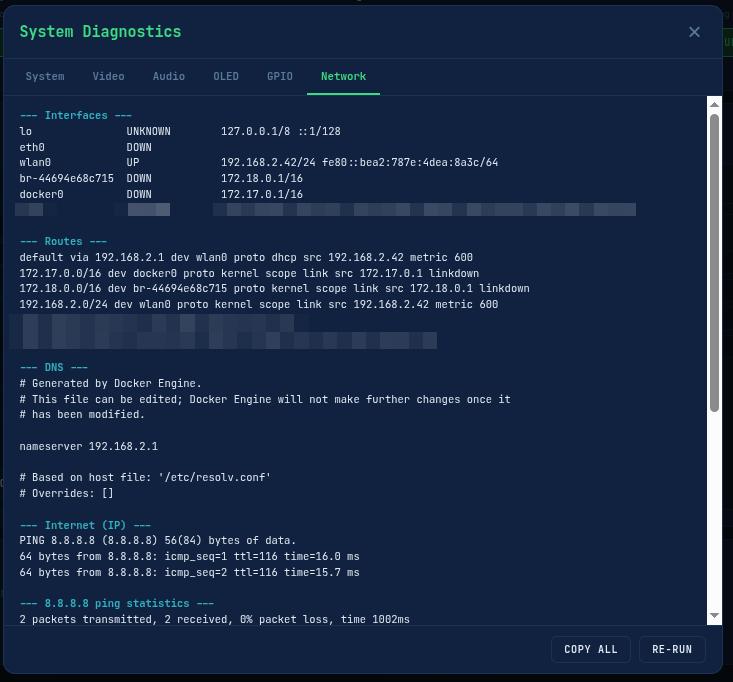
diagnostics.sh is the big one. It auto-detects whether it is running on the host or inside a Docker container and adjusts accordingly. It checks: OS and kernel info, Raspberry Pi thermal status and throttling, disk space and recording directory contents, USB device tree, video devices via v4l2-ctl, ALSA audio cards and mixer levels, PulseAudio/PipeWire status (should both be disabled), I2C bus for the OLED, all running FITEBOX processes, Docker container status, health files, recent logs, kernel error messages, network configuration, and CPU/memory usage. The full report is saved to /tmp/fitebox_diagnostic_YYYYMMDD_HHMMSS.txt so you can share it when asking for help.
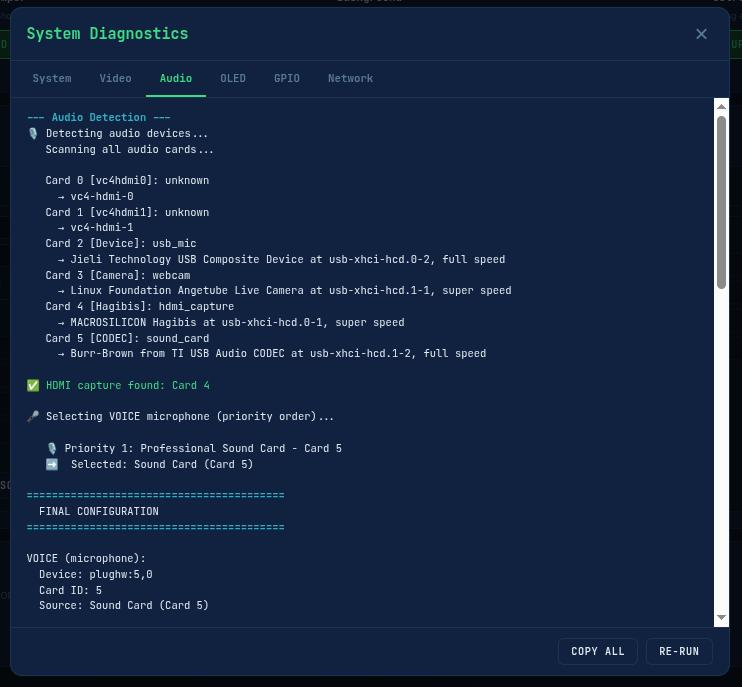
detect_audio.sh deserves special mention because it has a dual mode: run it directly for a full diagnostic, or source it from another script (like the recording engine) and it exports variables (VOICE_DEV, HDMI_DEV, VOICE_CARD_ID, etc.) silently. It classifies every ALSA card by type (hdmi_capture, webcam, sound_card, usb_mic, generic_usb) and selects the best microphone with a priority order: professional sound card → USB mic → generic USB → webcam (last resort). If the HDMI capture and voice mic end up being the same device (which would cause “Device or resource busy”), it automatically disables HDMI audio and falls back to voice-only mode.
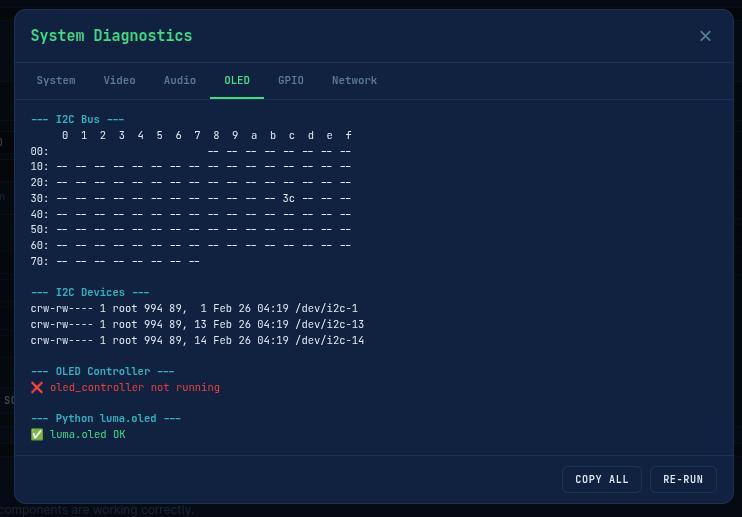
detect_oled.sh scans the I2C bus, finds the OLED at 0x3C or 0x3D, checks Python dependencies (luma.oled, Pillow), and then runs a series of visual tests on the display: clear screen, full white, border, text, animation, and a final info screen that stays on for 60 seconds so you can visually confirm the display is working. It even stops oled_controller.py if it’s running (since the OLED can only be controlled by one process) and restarts it afterwards.
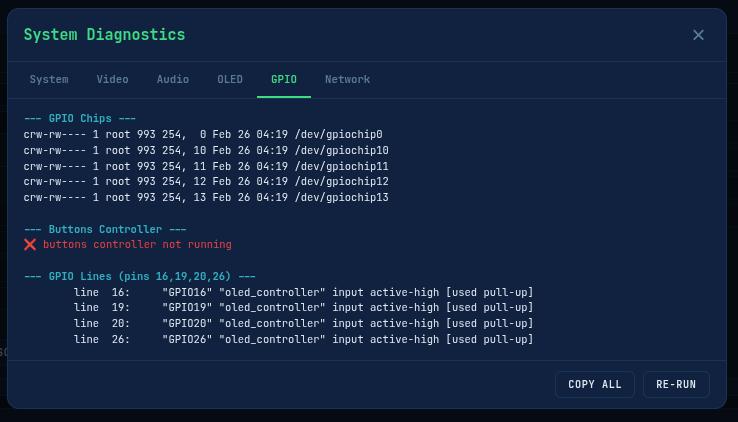
detect_buttons.py uses the FiteboxHardware abstraction to test all 4 GPIO buttons in real-time – press a button and see it reported on screen with PRESS/RELEASE events at 100Hz polling.
6.6 Build and Run with Docker
$ docker compose build
$ docker compose up -d
The container runs in privileged mode because it needs direct access to hardware devices: video (/dev/video*), audio (/dev/snd/*), I2C (/dev/i2c-*), GPIO (/dev/gpiochip*), and thermal sensors. This is not optional; without privileged mode, the container cannot access the capture cards, microphones, OLED display, or buttons.
When the container starts, three processes come up in sequence:
OLED controller – the display shows the FITEBOX logo boot animation
FITEBOX manager – starts polling hardware status
Web server – FastAPI on port 8080
6.7 Different Recording Parameters – Showing the Improvement
To understand why the recording engine is at version 36, it helps to see what different FFmpeg parameter choices look like in practice. During development, I tested many combinations on real Pi 5 hardware. Here are some examples:
Preset medium vs ultrafast: The medium preset produces better compression (smaller files, slightly better quality) but runs at ~0.7x the speed on the Pi 5, so it cannot keep up in real time. Frames are dropped, audio desyncs, and the recording is unusable. The ultrafast preset runs at ~1.0x speed (barely real-time), but the quality at CRF 28 is perfectly acceptable for conference recordings.
CRF 23 vs CRF 28: CRF 23 produces visually better video, but at roughly double the bitrate (~4.5 Mbps vs ~2.4 Mbps). On a Pi 5, the higher bitrate means more disk I/O and more CPU pressure on the encoder. CRF 28 at 1080p for slides, with a small speaker window, is more than good enough.
With and without aresample=async=1000: This one is only relevant for streaming, but it is dramatic. Without it, the streamed audio has periodic clicks every few seconds – inaudible artefacts from MKV AAC timestamp micro-irregularities that become audible when copied to FLV/RTMP. With async=1000, the audio is perfectly clean. More on this in the Streaming Pipeline section.
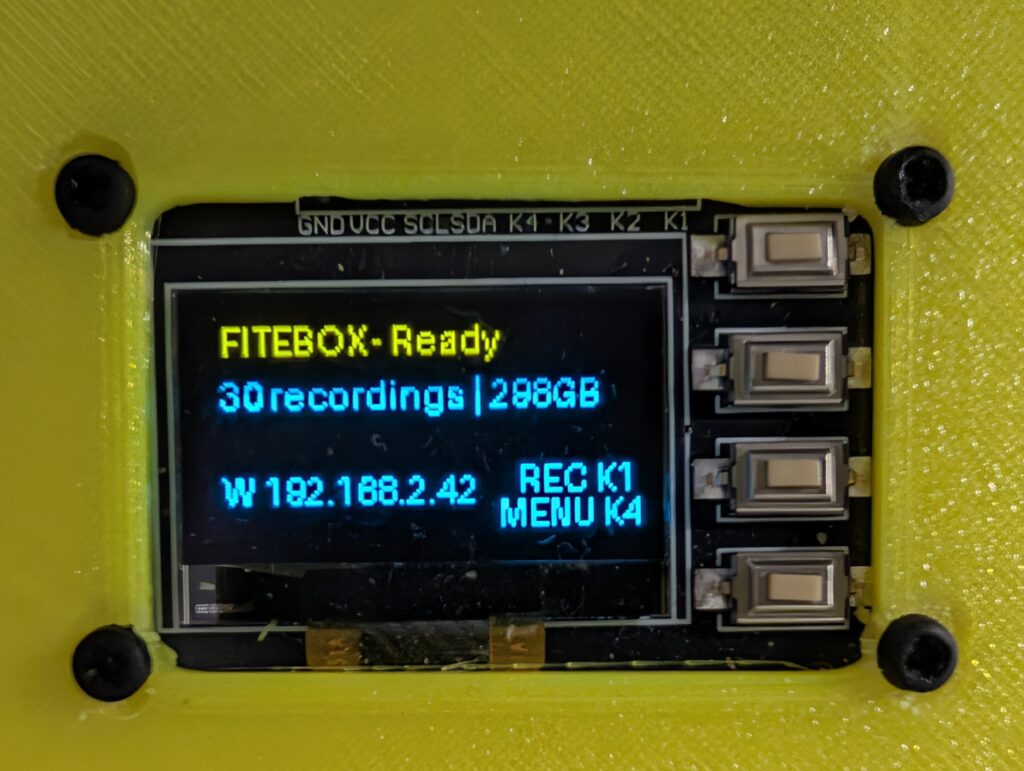
7. The OLED Controller – A Tiny Command Centre
The OLED controller (oled_controller.py) is the first process that starts and the central hub of FITEBOX’s internal communication. It manages the SSD1315 display (compatible with SSD1306), reads GPIO button presses, and runs a Unix domain socket server that the other processes connect to.
The Display
The OLED is a 128×64 pixel monochrome display driven by the luma.oled Python library. All rendering is done with PIL/Pillow: text, icons, and QR codes are drawn as bitmaps and pushed to the display. The project includes 12 pixel/retro fonts (ChiKareGo, FreePixel, ProggyTiny, DejaVuSansMono, and others) for different display contexts.
Boot Animation
When FITEBOX starts, the OLED shows a custom logo bitmap (128×64, 1-bit, base64-encoded in the source code). It is a small thing, but it tells you the system is alive before anything else is ready.
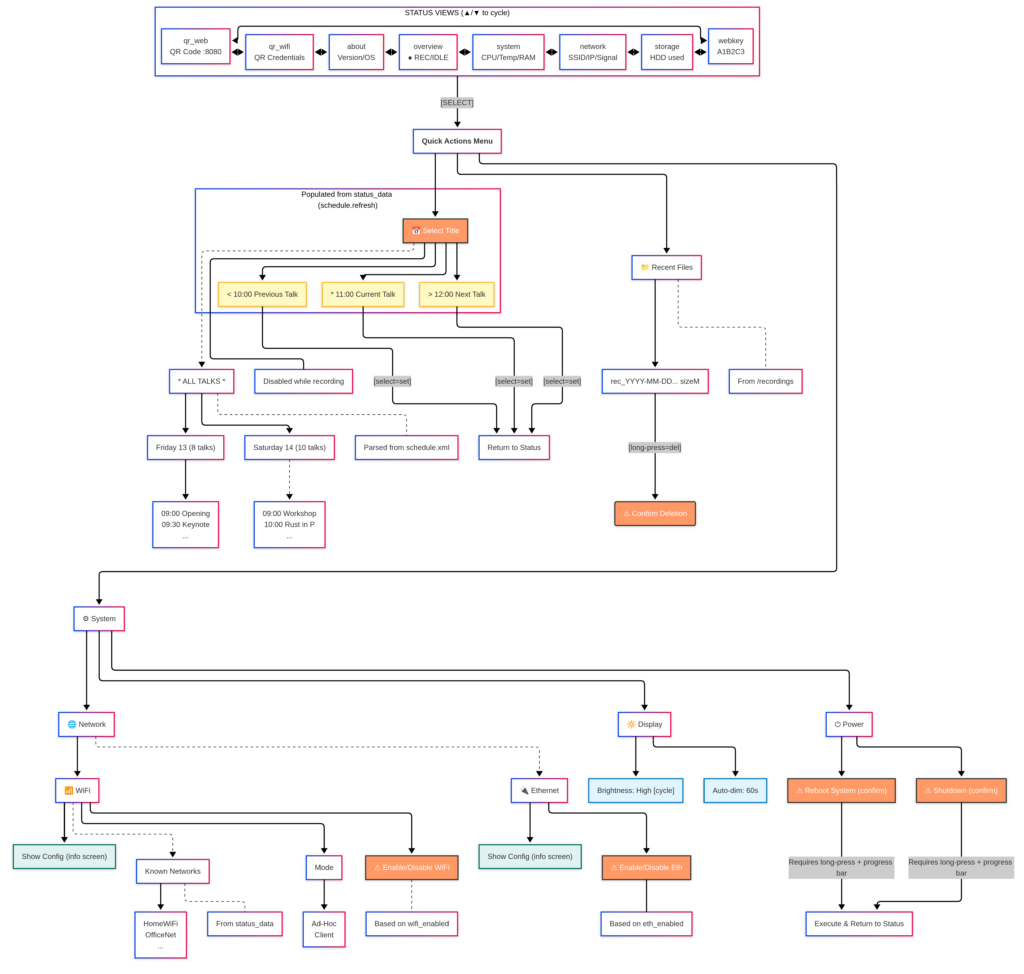
Status Views
After boot, the OLED cycles through 8 status views using the Up/Down buttons:
View
What It Shows
Overview
Recording state, elapsed time, CPU, temperature
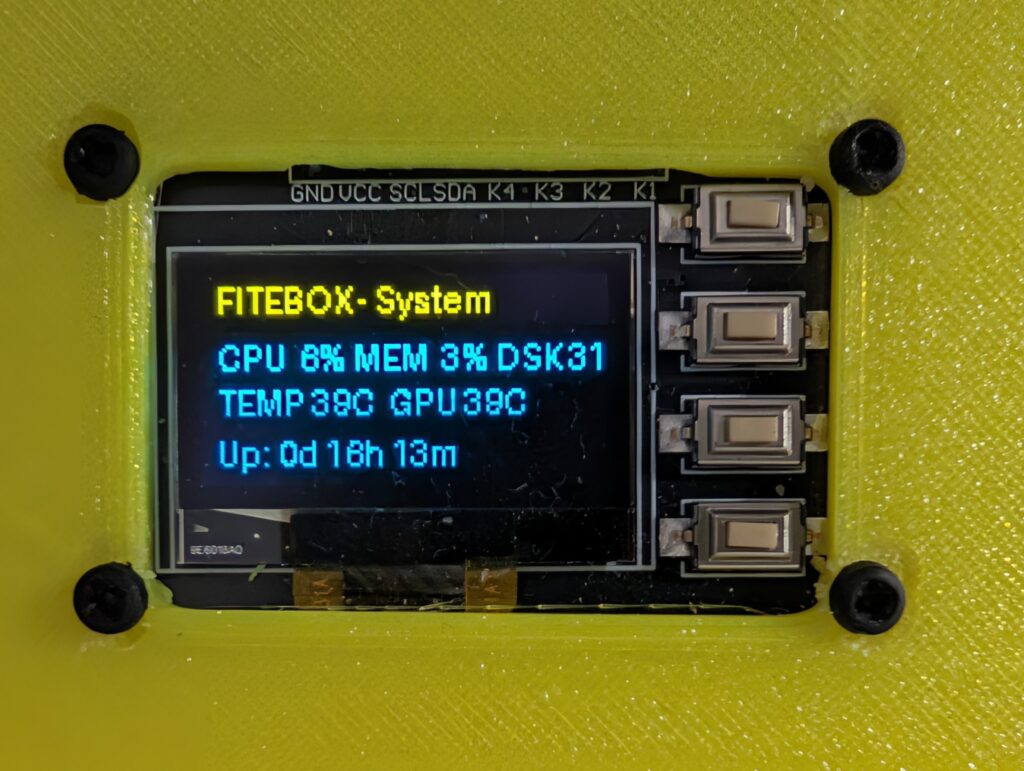
System
RAM usage, swap, load average
Network
WiFi SSID, IP addresses, signal strength
Storage
SSD usage, remaining recording time estimate
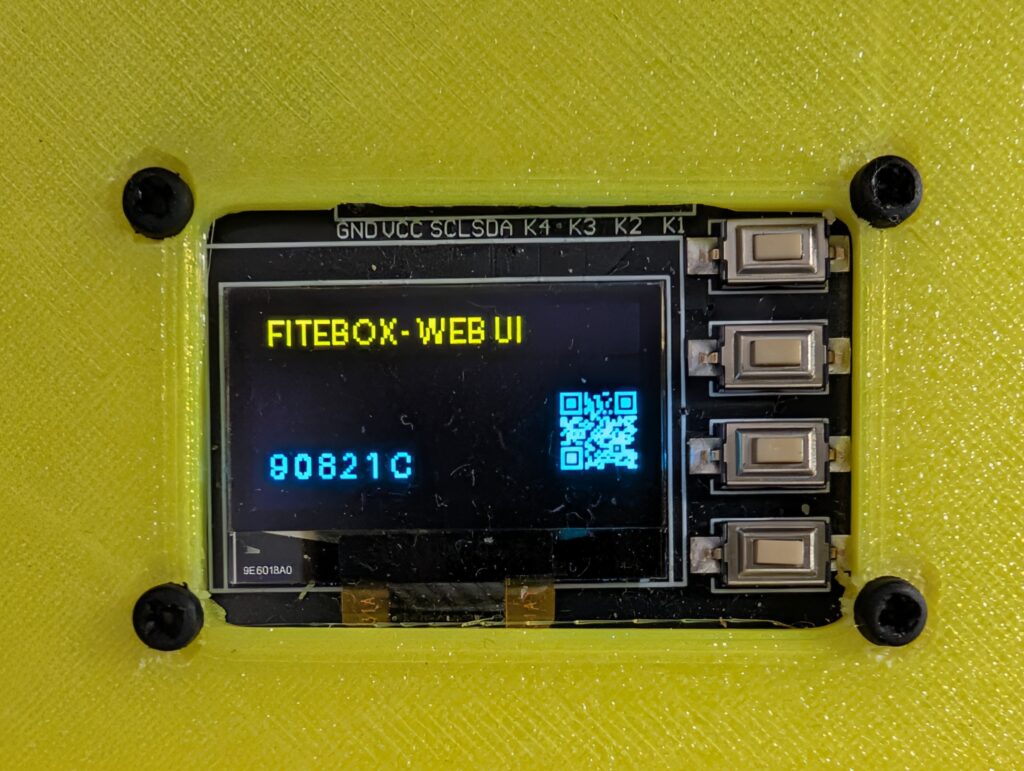
Web Key
The 6-character authentication key for the web UI
QR Web
QR code with the web UI URL – scan with your phone
QR WiFi
QR code with WiFi credentials – scan to connect
About
Version, hostname, uptime
System Status view
The Web Key display is particularly important. It shows a 6-character hex code (like A1B2C3) that you type into the web UI to authenticate. No passwords to remember. The key is generated from a random key and displayed right on the box, ready for the operator to use; a persistent master key is also available to the sysadmin.
QR Web view
The QR codes are generated with the qrcode Python library:
QR Web encodes https://IP. Point your phone camera at it, and the browser opens directly.
QR Wifi encodes the network credentials, so your phone can join the network instantly.
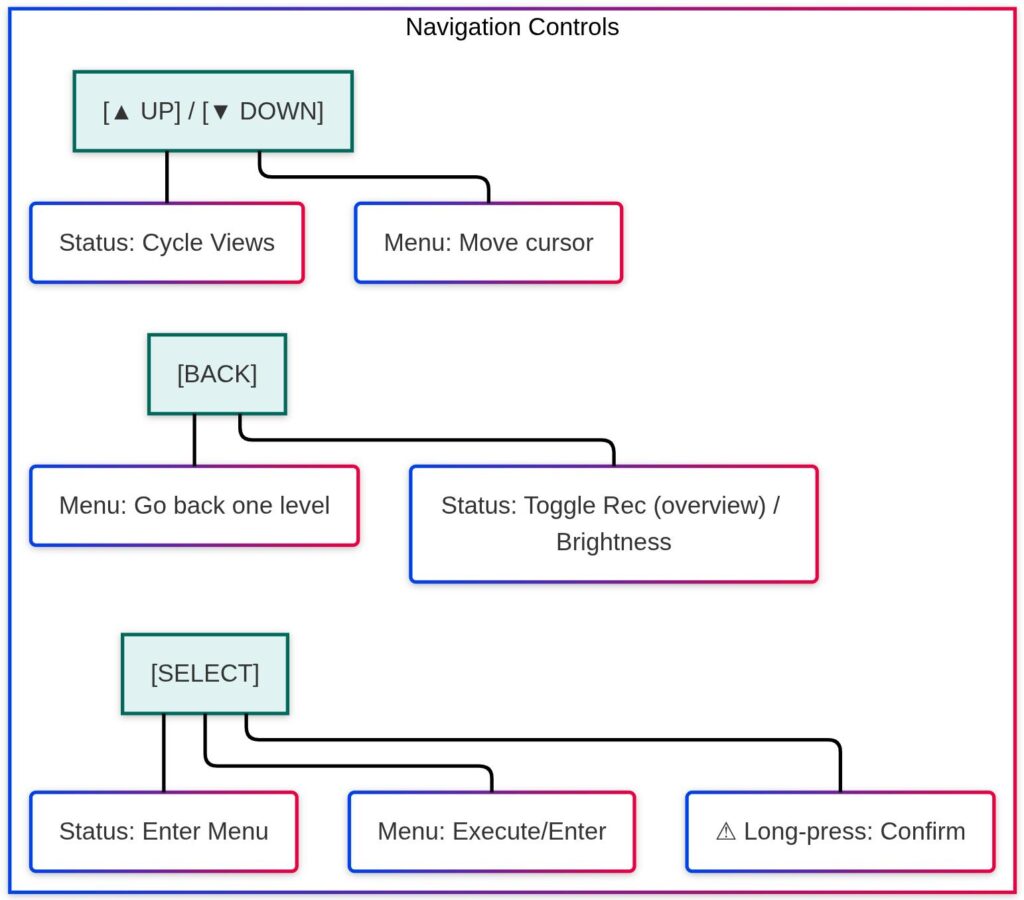
Interactive Menus
The menu navigation uses the 4 physical buttons: Back, Up, Down, and Select. The entire OLED interface can be used without a phone or laptop. A volunteer can start recording, check status, and navigate networks using just the buttons on the box.
Pressing the Select button on any status view enters the interactive menu system:
Network → Scan WiFi networks, connect, create a hotspot, and manage known networks
Files → Browse recordings stored on the SSD, you can delete them also
Schedule → Browse talks by day and room, select the current session
System → Reboot, shutdown
Buttons and GPIO
The buttons use the gpiod library (v2 API) with software pull-up resistors.
Each button triggers an interrupt through gpiod with debounce handling. No polling loops wasting CPU.
The Socket Hub
This is an architectural detail that matters: the OLED controller is not just a display driver. It runs a Unix domain socket server at /fitebox/run/fitebox_control.sock. The FITEBOX manager and the web server connect to this socket as clients. The OLED controller acts as a message hub. When the manager sends a status update, the OLED controller broadcasts it to all connected clients (including the web server, which then pushes it to browsers via WebSocket).
The protocol is newline-delimited JSON over the Unix socket. Simple, debuggable, and reliable.
The repo includes oled_clients.py, an example client with an interactive menu that lets you connect to the socket and test things manually: update system status, start/stop recording, listen for button events, or run continuous monitoring with real psutil data. It is very useful during development and debugging.
This hub-and-spoke pattern means the OLED display, the web interface, and the manager all share the same real-time status stream. When you see a recording timer on the OLED, the web dashboard shows the same timer. They are fed by the same data.
8. The Web Interface – Control from Your Phone
The web interface is a FastAPI application (web/fitebox_web.py) running on port 8080 with Jinja2 templates and vanilla JavaScript (no React, no Vue, no build tools). It serves HTML, a REST API, and a WebSocket endpoint for real-time updates.
The CSS uses a dark theme (#1a1a2e background) with a mobile-first responsive design. Accent colours encode state: red for recording, blue for streaming, green for success.
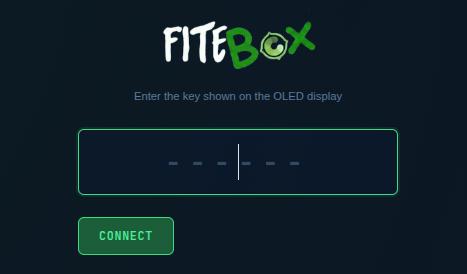
Authentication
FITEBOX uses HMAC-SHA256 signed requests for authentication. The flow:
Read the 6-character hex key from the OLED screen
Type it into the web login page
All subsequent API calls are signed: HMAC(timestamp:body, key)
Replay protection with a 30-second timestamp window
No usernames, no passwords, no accounts. The key rotates between container restarts (also, there is a persistent master key in config/master.key).
The JavaScript client library (fitebox.js) handles HMAC signing, WebSocket reconnection (3-second auto-reconnect), and UI feedback (toasts, confirmation modals) automatically.
Login Page
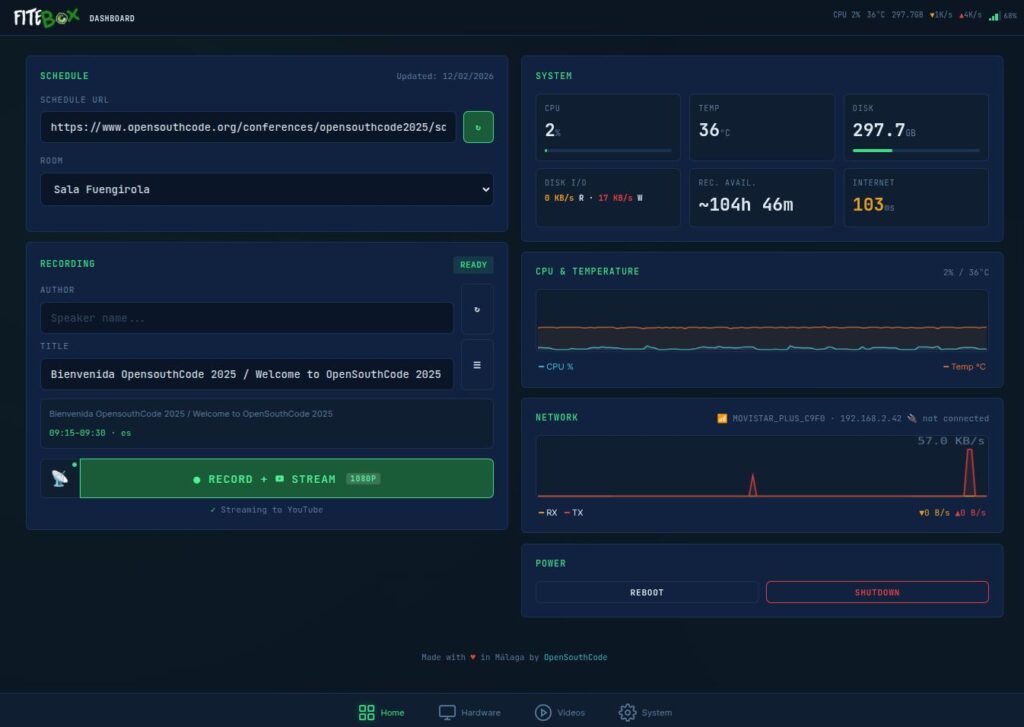
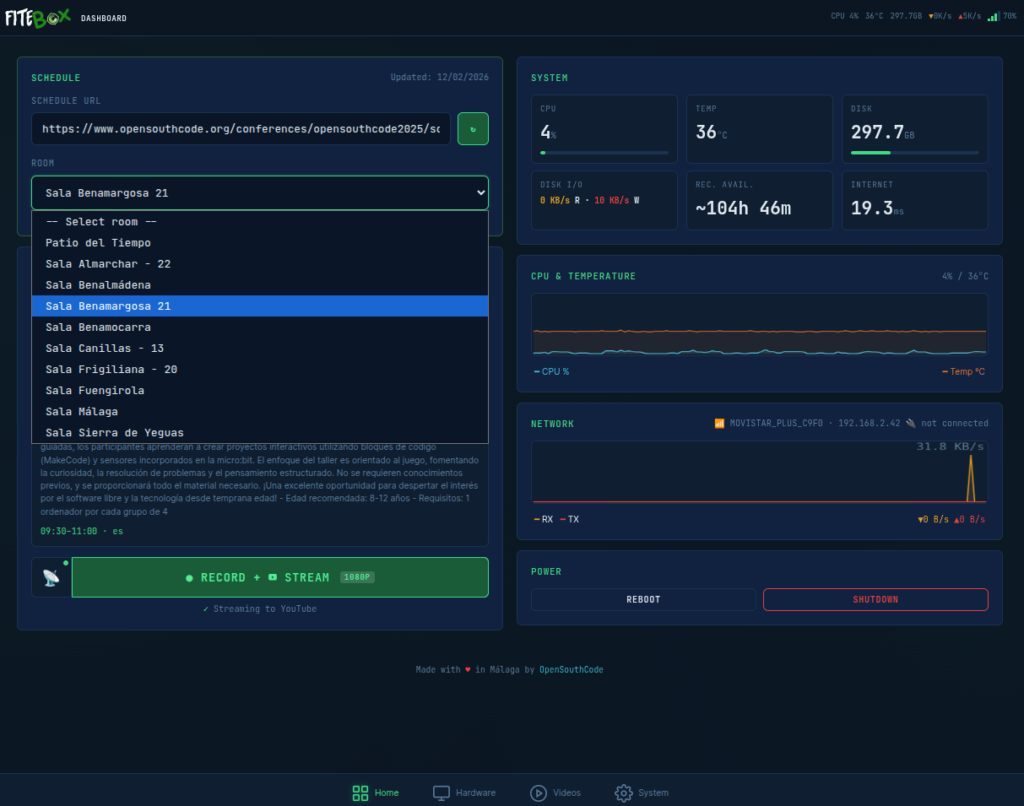
Dashboard
The Dashboard (/dashboard) is the main control panel. Everything you need during the event is on this single page.
Schedule integration: Paste the URL to your conference’s Frab/Pentabarf schedule XML (the standard format used by FOSDEM, CCC, OpenSouthCode, and many others), download it, and select the room assignment for this FITEBOX. The parser (lib/schedule_parser.py) extracts all talks by day and room.
Session info: If a conference schedule is loaded, the dashboard shows the current talk title and speaker name based on the room assignment and current time.
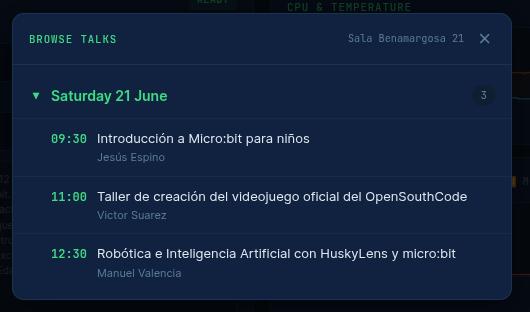
If you prefer to choose a different talk, click on the 3 lines icon ( ☰ ), and you will get the list of talks for that room for all days of the venue:
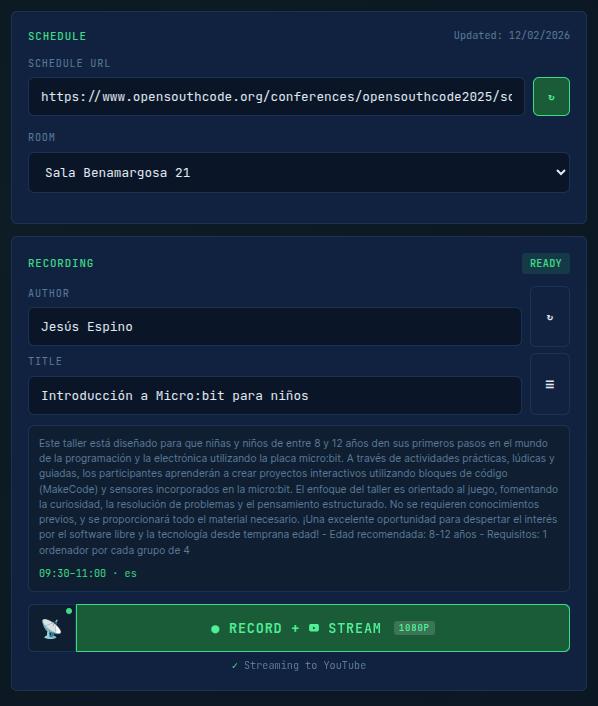
Once choosen you will be able to see all the details of the talk and start RECORDING:
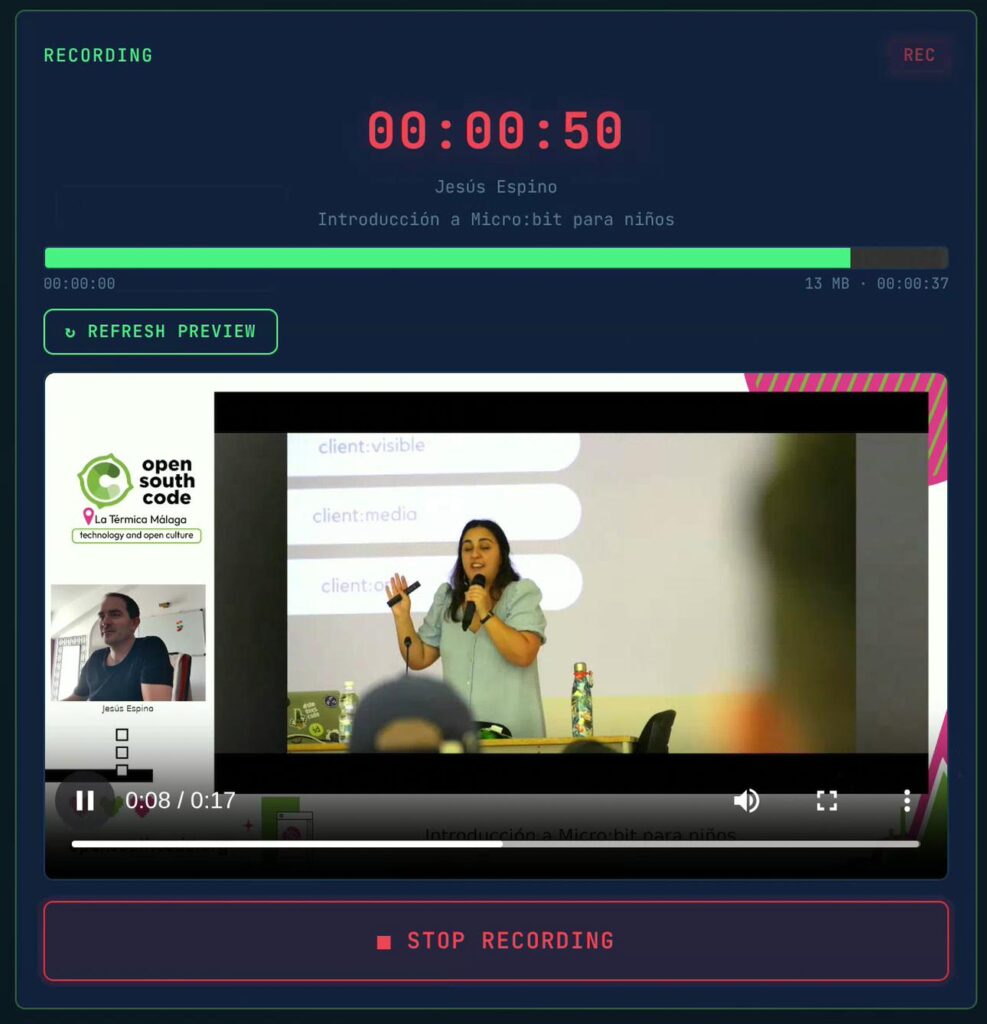
Recording controls: the recording window includes a feature that lets you extract a ~15-second video clip from the growing MKV file and make it playable in the browser. This uses the “sandwich” technique (more on this in the Recording Engine section) and lets you confirm that the composite layout looks correct without stopping the recording. A large STOP button and several other indicators are visible in this window: a recording timer, the current file size, and session information from the conference schedule. That green line is the Health Histogram.
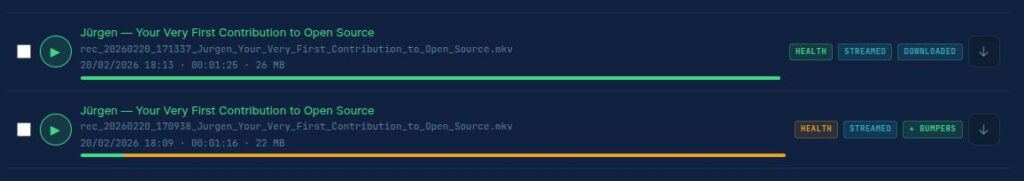
Health Histogram: one of my favourite features. It shows live FFmpeg stats parsed from the recording engine’s log: frames per second, bitrate, encoding speed, and dropped frames. If the encoding speed drops below 1.0x, you know immediately that something is wrong. One curious detail is that the bar never reaches the end because the video is still recording, and more data will be available seconds after the last analysis is completed. We will get back to this in the Videos section.
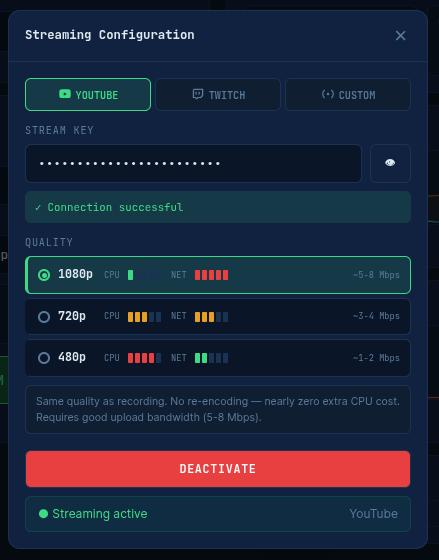
Streaming controls: in this button, you can control the streaming destination picker (YouTube / Twitch / Custom RTMP), and the stream key input. When you fill in the key, FITEBOX verifies it is valid and that it really connects to the selected service.
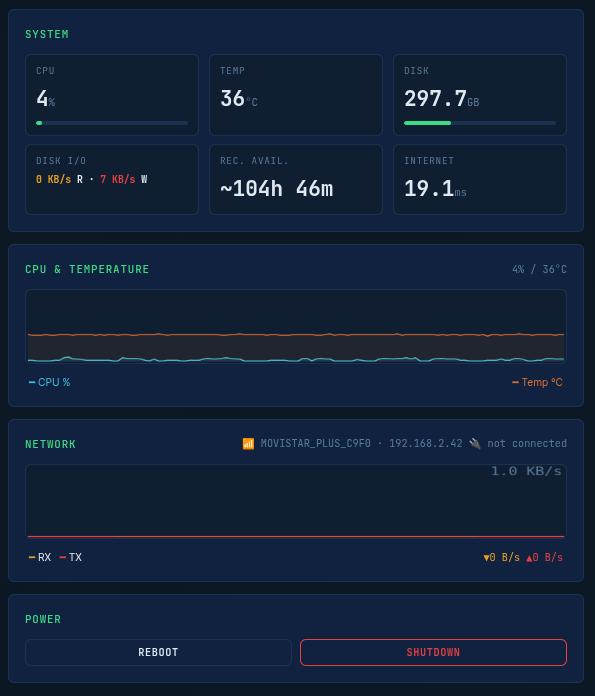
System stats: RAM usage, swap usage, disk I/O rates, network ping, and an estimated remaining recording time based on the current bitrate and available disk space.
CPU and temperature chart: A 10-minute sparkline rendered from a server-side ring buffer (collections.deque(maxlen=120)). When you connect via WebSocket, the server sends the full metrics history so the chart renders instantly – no waiting for data to accumulate.
Network chart: Unified WiFi + Ethernet RX/TX chart with a noise threshold filter to avoid showing irrelevant background traffic.
Network info: Inline display of WiFi SSID, WiFi IP, and Ethernet IP. Both interfaces are shown simultaneously because FITEBOX supports dual-stack networking.
Power controls: Reboot and Shutdown buttons with confirmation dialogues.
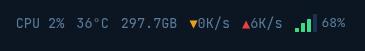
Header: All these stats are also available at all times in the header anywhere in the UI. When recording and streaming, FITEBOX goes through several steps:
Usual view when the system is in stand-by
Step 1 – FITEBOX waits 30 seconds and then starts buffering around 15 seconds
Step 2 – INTRO is being sent around 00:50
Step 3 – Once INTRO is sent, FITEBOX goes LIVE
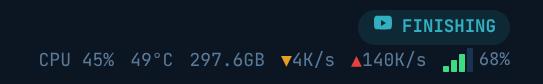
Step 4 – When STOP RECORDING is clicked, FITEBOX finishes recording and waits while draining the rest of the buffer to the streaming service
Step 5 – Once the buffer has been drained, FITEBOX sends the OUTRO and finishes
In spanish we say that is better one image than a thousand words, here you have the 2 sides of a recording.
On one side is me recording with my cellphone:
On the other side is the final video streamed online without any edits (also a copy of the video, the original recording, is stored inside FITEBOX):
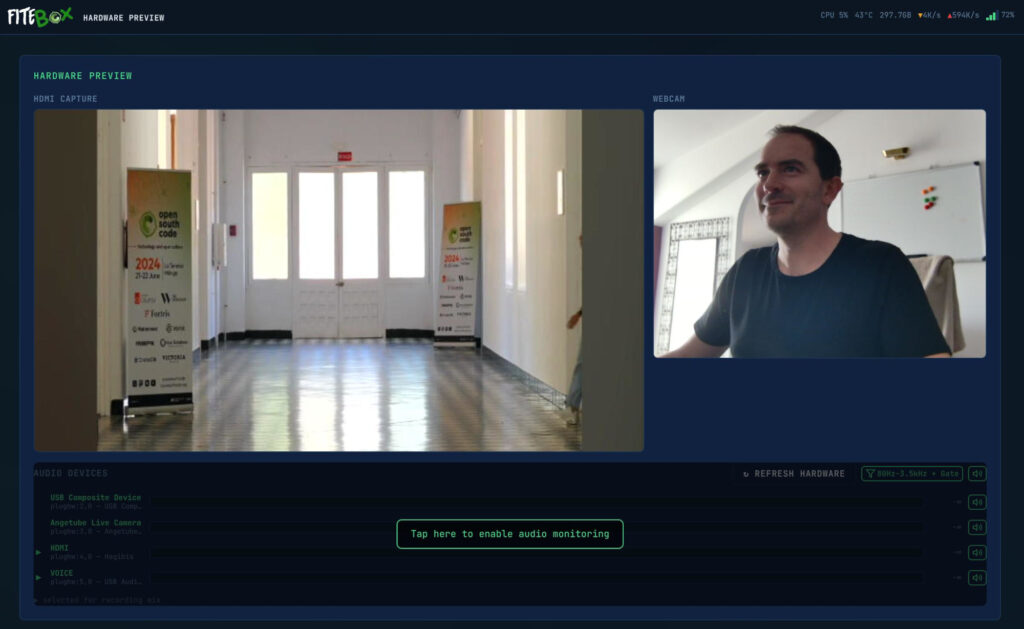
Hardware Page
The Hardware page (/hardware) is for setup verification before recording starts.
If this is your first visit, you will be asked to click enable audio monitoring to grant the browser the required permissions to open the audio streams. Once clicked, the browser’s buffer will start receiving the audio from the different devices (the browser will play the audio once it considers it has enough audio in the buffer, which is about 7 seconds):
There is a 7-second lag between the video and the audio: It is normall and it doesn’t matter since this window is exclusively for setting up the scene and checking that the required devices are working. The green arrows on the left indicate which devices will be used during the recording (this selection is automatic and you can not change it)
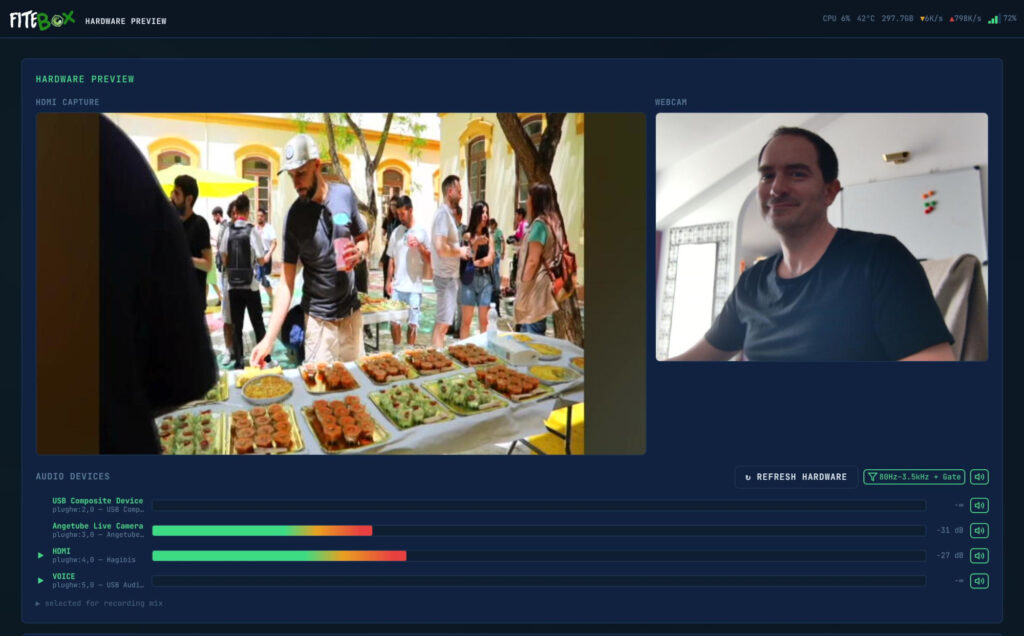
MJPEG live preview: Both camera feeds (HDMI capture and webcam) are displayed at 2 fps with zero CPU cost. This works because the camera’s output is MJPEG natively, the web server just passes the JPEG frames through without re-encoding anything (-c:v copy).
Audio monitoring: MP3 streams from ALSA devices, playable directly in the browser with Web Audio API analysis driving VU meter visualisations.
Device detection: Automatic classification of all connected video and audio devices.
Important details:
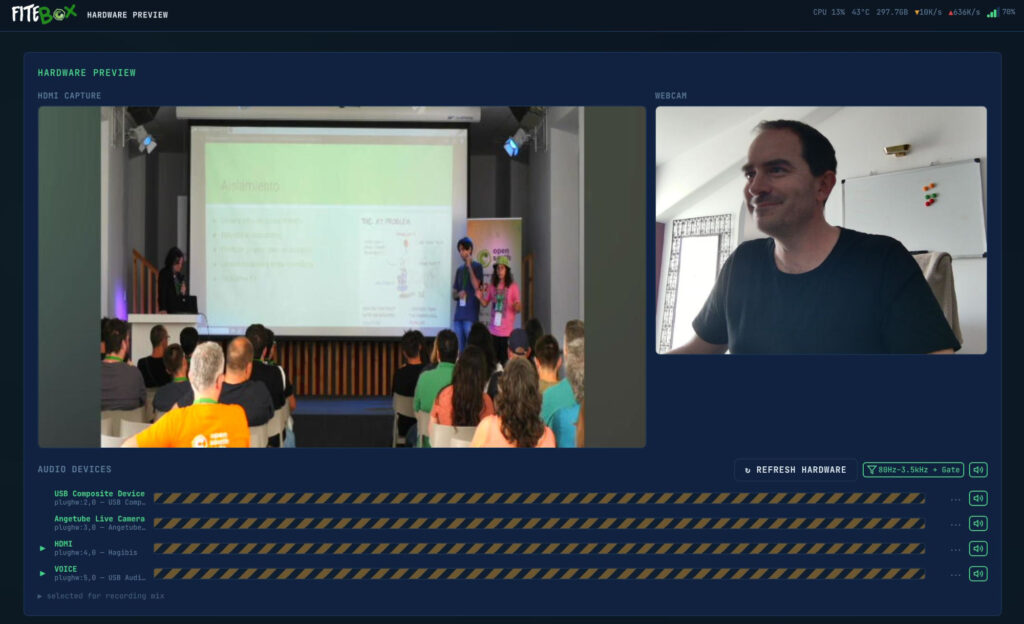
You must stop the preview before starting a recording, because the video devices require exclusive access. The UI enforces this.
This preview will be empty during recordings to contribute to the recording engine’s exclusive access.
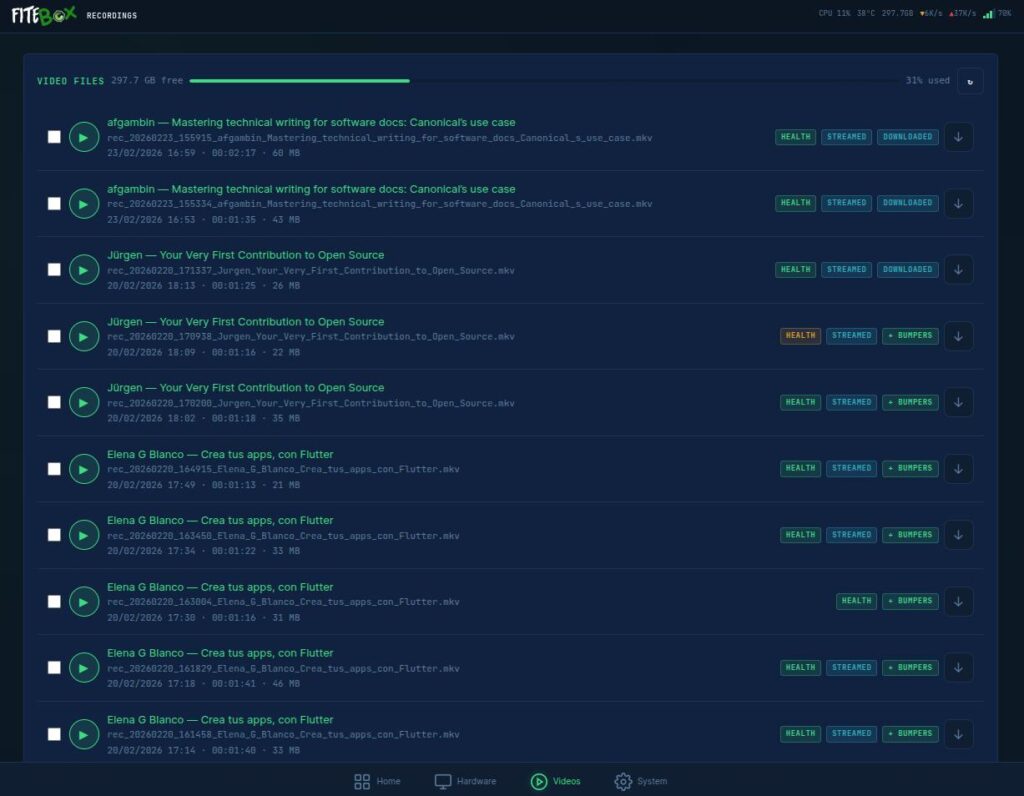
Videos – The Recordings Page
The Recordings page (/recordings) is the file manager.
Health Histogram: here you can see the histogram of every recording, so it warns you which videos had troubles while recording.
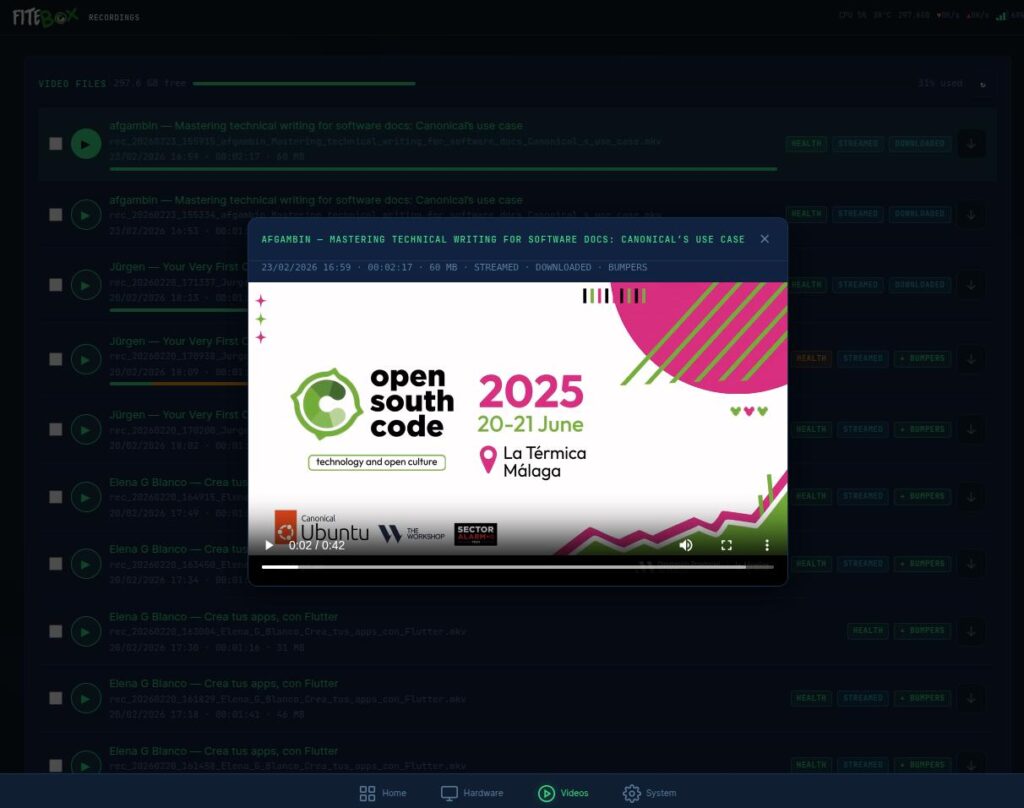
In-browser playback: MKV files cannot be played natively in most browsers, but FITEBOXremuxes them to MP4 on-the-fly using FFmpeg with -c copy (zero CPU, just container repackaging). The video plays directly in the browser.
Bumper concatenation: on every recording, you can click “Apply Bumpers” to combine your intro, recording, and outro into a single file. The system validates A/V sync and duration automatically and keeps a .pre-bumper backup of the original.
Metadata: Each recording has a JSON sidecar with author, title, date, duration, and technical details.
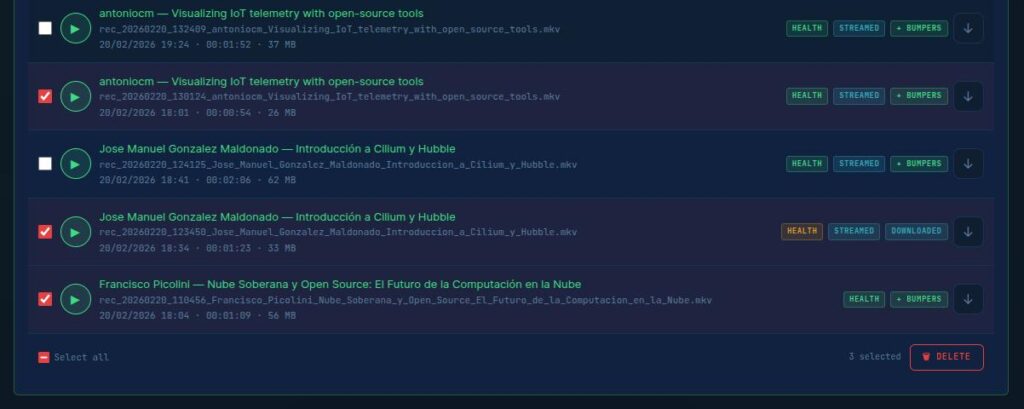
Deletion: If something went wrong, you can also DELETE files.
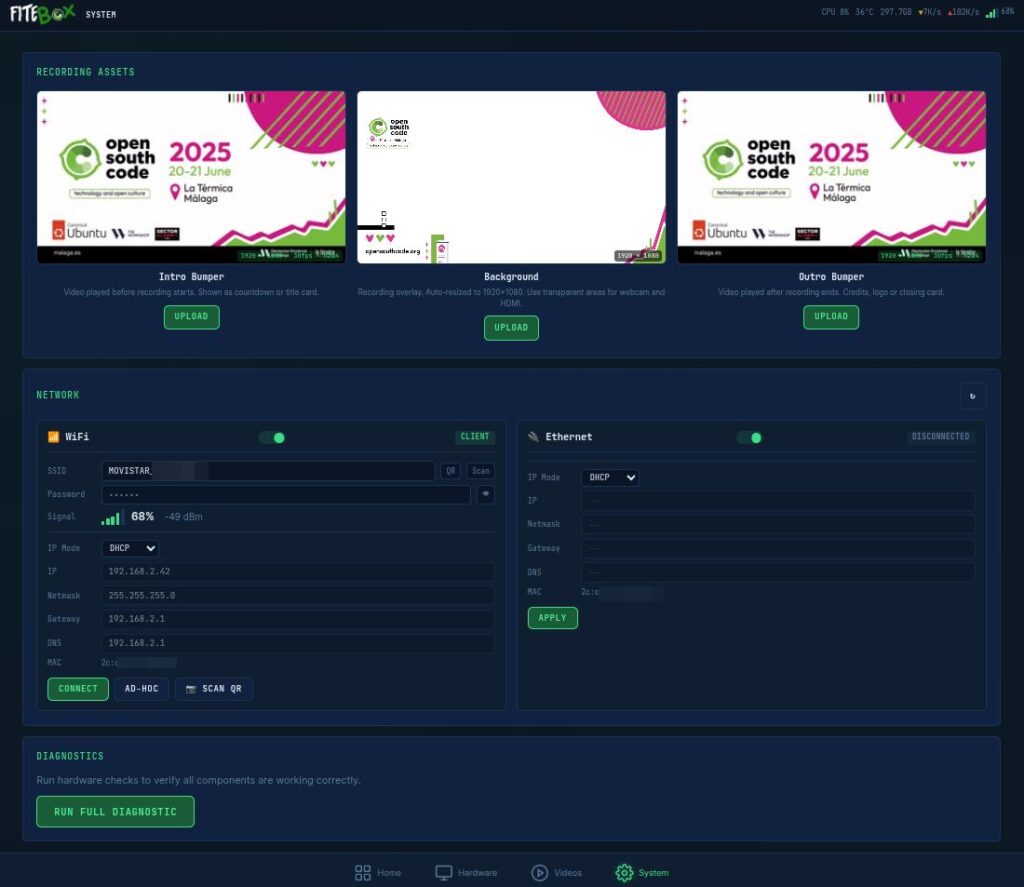
System Page
The System page (/system) is for pre-event configuration.
Bumper upload: Upload intro/outro video clips in any format. FITEBOX probes them with ffprobe, shows you the specs, and either copies them instantly (if the format matches: 1080p, 30fps, H.264, AAC 48kHz) or re-encodes them to match. A thumbnail preview is extracted.
Background upload: Upload your 1920×1080 branded PNG that serves as the composite recording frame. Keep in mind that the webcam and laptop images are fixed in place in this version.
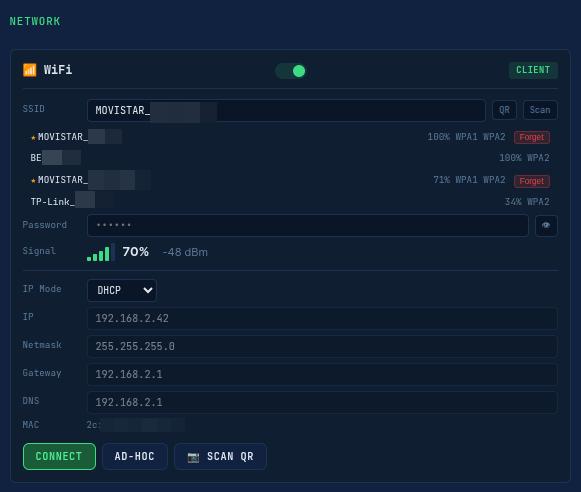
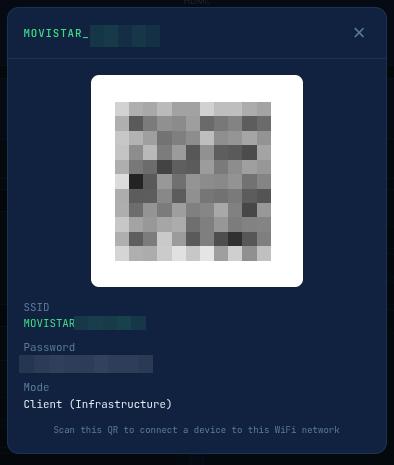
Network management: Scan WiFi, connect to networks, create a hotspot (FITEBOX_AP), set static IP, and view Ethernet status.
The QR button shares the actual wifi in use:
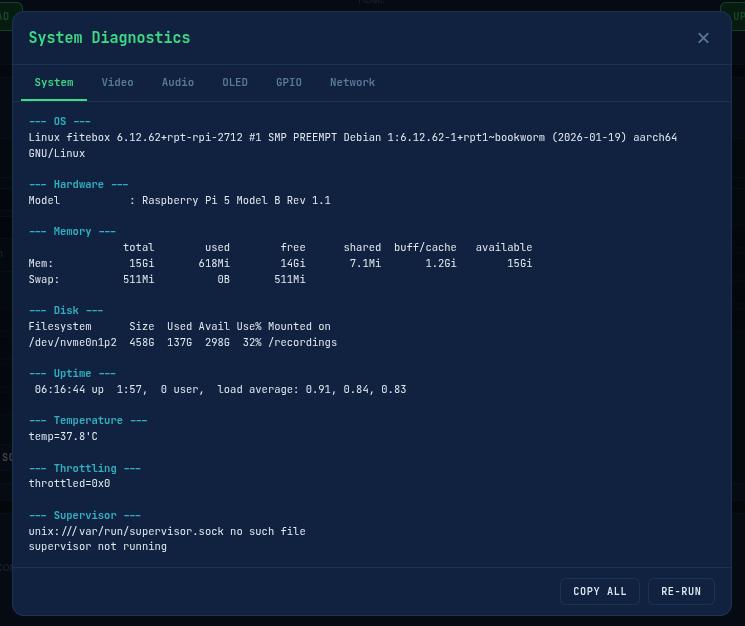
Diagnostics: Hardware, audio, video, network, and storage checks. Run this before the event to debug and resolve issues.
(OLED is in use by the OLED CONTROLLER, so at this point it will fail as shown)(GPIO is in use by the OLED CONTROLLER, so at this point it will fail as shown)
9. The Recording Engine – FFmpeg v36 Deep Dive
The recording engine (recording_engine.sh, version 36) is the heart of FITEBOX. It reached version 36 because each version fixed a real bug discovered during manual testing on actual Pi 5 hardware. This is not a script I iterated in a simulator; each version was tested with real capture cards, real audio devices, and real conference scenarios.
The Composite Layout
The recording produces a 1920×1080 canvas with multiple layers:
FFmpeg Inputs
The engine feeds 5 inputs to a single FFmpeg process:
USB devices do not enumerate in a deterministic order. On one boot /dev/video0 might be the webcam, on the next boot, it might be the HDMI card. The recording engine solves this by detecting devices by name, not by number:
Audio detection works the same way. The detect_audio.sh script classifies ALSA cards into categories: hdmi_capture, webcam, sound_card, usb_mic, generic_usb. It then force-unmutes all capture channels, because some USB audio cards ship with capture channels muted by default:
amixer -c $CARD_NUM set Capture 100% unmute
amixer -c $CARD_NUM set Mic 100% unmute
amixer -c $CARD_NUM set 'Digital In' 100%
Audio Mixing
If two audio sources are detected (room mic + HDMI audio), FFmpeg combines them:
amix=inputs=2:duration=first:dropout_transition=2
If only one source is present, it passes through unchanged with acopy.
The Video Filter Chain
The composite is built using FFmpeg’s filter_complex:
The background PNG is loaded as a looping video source at 30fps
The HDMI capture (1280×720 MJPEG) is scaled to 1520px wide and overlaid at position (360, 40)
The webcam (640×480 MJPEG) is scaled to 330px wide and overlaid at position (12, 450)
setsar=1 is applied to fix SAR (Sample Aspect Ratio) issues from MJPEG capture
Text overlays for the speaker name and talk title are drawn with drawtext
Output Configuration
  Encoder .... libx264 (software - NO hardware encoder on RPi5)
  Preset ..... ultrafast (the only preset that achieves ~1.0x speed)
  Profile .... Constrained Baseline (forced by ultrafast)
  Tune ....... zerolatency
  CRF ........ 28 (good quality for conference content)
  Resolution . 1920×1080 at 30fps
  Audio ...... AAC LC, 192 kbps, 48 kHz, stereo
  Container .. MKV (Matroska)
  Bitrate .... ~2.4 Mbps total (~1 GB/hour)
Why ultrafast? Because the Raspberry Pi 5 has no hardware H.264 encoder. All encoding is pure software libx264. The ultrafast preset is the only one that achieves real-time encoding speed (~1.0x) at 1080p on the Pi 5’s quad-core ARM CPU. Any other preset drops below 1.0x, and frames are lost.
Why MKV? Because Matroska writes data incrementally in clusters. If FFmpeg is killed (power failure, Docker stop, crash), all data up to the last completed cluster is recoverable. With MP4, a crash means the file is usually unplayable because the moov atom at the end was never written.
The “Sandwich” Preview
This is one of the more creative technical solutions in FITEBOX. While FFmpeg is actively writing to an MKV file, you cannot simply cp or ffprobe that file, the file is locked and in an inconsistent state. But we need to extract a preview clip for the web dashboard.
The solution: read the first 1MB of the file (which contains the MKV headers and track information) and the last 10MB (which contains the most recent video data), concatenate them into a temporary “sandwich” file, probe it for keyframes, and extract a ~5-second clip with an output seek.
[ first 1MB (headers) ] + [ last 10MB (recent data) ] = "sandwich.mkv"
→ ffprobe finds keyframes → extract ~15s clip → serve to browser
It sounds hacky. It works reliably.
10. The Streaming Pipeline – Single Pipe to YouTube
The streaming pipeline (implemented in web/fitebox_web.py as Python asyncio code) was the hardest part of the entire project. I tested and rejected at least 7 different approaches before arriving at the one that works:
Rejected approaches:
tail -f on the MKV file → irregular byte bursts break Matroska cluster parsing
FFmpeg tee muxer → “Slave muxer #0 failed” on FFmpeg 5.1
Multiple RTMP connections (one per segment) → YouTube sees separate streams, audience gets “stream ended”
concat demuxer with -c copy → H.264 profile mismatch between bumpers (Main) and recording (Constrained Baseline) → 7-second A/V desync
filter_complex with split outputs → can only be mapped once without explicit split/asplit
And several more variations
What Actually Works: The Single-Pipe Architecture
One persistent FFmpeg output process maintains a single RTMP TCP connection throughout the broadcast. Content segments (intro bumper, live recording, outro bumper) are fed sequentially as MPEG-TS via the output process’s stdin.
The critical detail in the live phase is that the video uses -c:v copy – zero CPU. The Pi 5 cannot sustain two simultaneous 1080p encodes (recording + stream). By copying the already-encoded video from the MKV and only re-encoding the audio, the streaming overhead is negligible.
Timestamp Continuity
Each feeder process uses -output_ts_offset to chain timestamps correctly:
intro starts at ts = 0
live starts at  ts = intro_duration
outro starts at ts = intro_duration + live_duration
Without this, YouTube sees timestamp jumps between segments → buffering → stream dies.
The Audio Click Fix
This one took approximately 10 manual tests on real hardware to solve.
The problem: AAC packets in MKV containers have micro-timestamp irregularities on the order of milliseconds. During normal playback, these are inaudible. But when you copy those AAC packets directly to FLV/RTMP, the irregularities produce audible clicks every few seconds on the stream.
The wrong fix:-af aresample=async=1 – too gentle, does not correct enough drift.
The wrong fix:-c:a copy – preserves the broken timestamps entirely.
The correct fix:
-af aresample=async=1000
This aggressively corrects timestamp drift greater than ~21ms by inserting or dropping audio samples. The CPU cost of audio re-encoding is negligible compared to video.
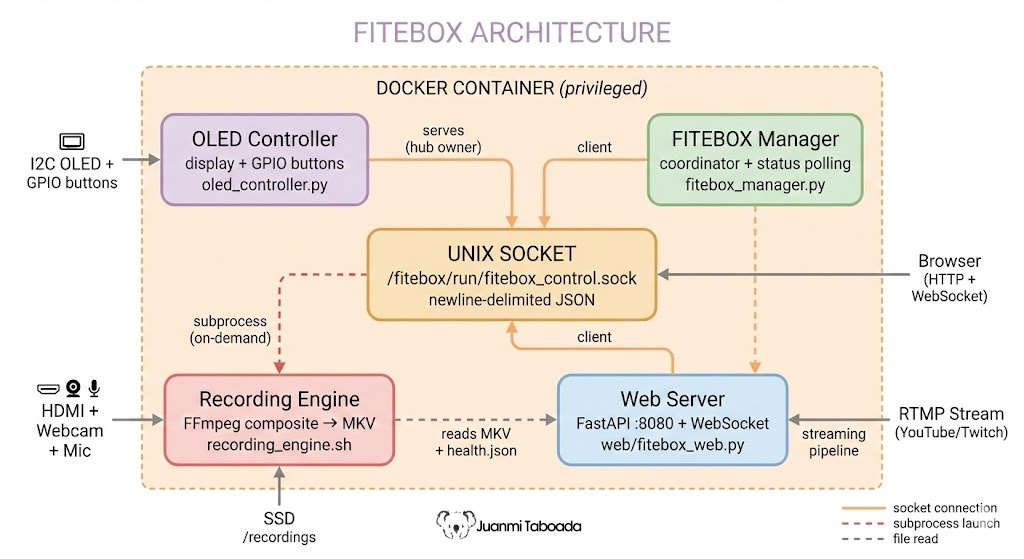
11. Software Architecture – The Ghost in the Machine
Process Communication
FITEBOX runs as a single Docker container with four main processes:
Why not microservices? A Raspberry Pi is not a Kubernetes cluster. One container, all processes, Unix socket communication. Simpler to deploy, debug, and maintain. Starts faster. Uses less memory.
The Makefile provides convenient targets for running individual services during development: make oled_controller, make fitebox_manager, make fitebox_web, make recording_start, make recording_stop. It also handles Plymouth screen messages and background image conversion. During production, the Docker entrypoint handles service orchestration.
CPU Optimisation – The 85% Reduction
This matters because the Pi 5 CPU runs at capacity during recording. Every CPU cycle stolen by the monitoring system is a cycle FFmpeg cannot use.
The manager loop was initially taking 1.3 seconds per iteration with 20 subprocess forks (calling vcgencmd, nmcli, df, etc.). After optimisation:
Metric
Before
After
Improvement
Manager loop time
1.3s
0.2s
85% reduction
Subprocess forks per iteration
20
2
90% reduction
Frontend API calls per update
3 endpoints
1 unified
66% reduction
Network info cache TTL
5s
60s
12x fewer forks
Key techniques:
Non-blocking CPU measurement:psutil.cpu_percent(interval=None) instead of interval=1 (eliminates a 1-second blocking call)
Sysfs temperature reads:/sys/class/thermal/thermal_zone0/temp (instant file read) instead of vcgencmd subprocess
Static data caching: MAC addresses, gateways, and DHCP info cached for 60s. Only IPs and signal strength in the fast loop.
Adaptive polling interval: 3s during idle, 5s during recording (was fixed 2s)
Server-side ring buffer:collections.deque(maxlen=120) for CPU/temp/network metrics (~2KB memory). Sent to the browser on WebSocket connect for instant chart restoration.
Delta log parsing: FFmpeg log read incrementally (only new bytes since last read)
Visibility-state polling: Browser polls every 5s when visible, every 30s when the tab is hidden
Signal Handling
The Docker entrypoint (entrypoint.sh) traps SIGTERM to ensure clean shutdown:
trap 'graceful_shutdown' SIGTERM
When Docker sends SIGTERM (on docker stop), the entrypoint gracefully stops all services in order. FFmpeg receives a clean exit signal, writes the final MKV headers, and the file is properly finalised. Without this trap, a docker stop would corrupt the current recording.
WebSocket Protocol
The WebSocket endpoint (/ws) authenticates on first message ({key: '...'}) and then pushes server messages:
Message Type
Frequency
Content
status_update
Every 3-5s
Full system state (CPU, temp, recording, network, disk)
metrics_history
Once on connect
Ring buffer for CPU/temp/network charts
response
On command
Command execution results
error
On failure
Authentication failures, command errors
12. Hard-Won Wisdom – Lessons from the Trenches
These lessons come from many manual tests on real Raspberry Pi 5 hardware and the complete failure of our first production deployment at OpenSouthCode 2025. Each one costs hours of debugging.
The Raspberry Pi 5 Has No Hardware H.264 Encoder
I cannot stress this enough. The Pi 4 had v4l2m2m. The Pi 5 does not. This is a hardware decision by the Raspberry Pi Foundation, not a software bug. Do not waste time trying to enable it. All encoding must be software libx264. The entire FITEBOX architecture – the ultrafast preset, the -c:v copy streaming, the CPU optimisation work exists because of this single hardware limitation.
PulseAudio Will Block Your Recording
If PulseAudio is running, it exclusively grabs ALSA devices. FFmpeg cannot access them directly. The solution:
pulseaudio -k && sleep 1
In Docker, either do not install PulseAudio at all or kill it in the entrypoint before starting services.
USB Audio Cards Ship Muted
This one caught me multiple times. Some USB audio cards arrive with their capture channels muted by default. The device appears in arecord -lFFmpeg opens it without error, but the recording is silent. Always force-unmute all channels before recording.
USB Device Order Is Random
/dev/video0 is not guaranteed to be the same device across reboots. Always detect by device name, never by device number.
MKV + AAC + RTMP = Audio Clicks
Covered in detail in the Streaming Pipeline section. The fix is aresample=async=1000. Always.
Docker SIGTERM Kills Your Recording
Without a SIGTERM trap in the entrypoint, docker stop sends SIGTERM directly to all processes. FFmpeg dies instantly. The MKV is corrupted. Always test: run docker stop while recording and verify the MKV plays correctly.
The Official Power Supply Is Not Optional
Cheap USB-C adapters cause voltage drops under load. The Pi 5 throttles the CPU (encoding speed drops below 1.0x), and USB devices randomly disconnect (your capture card or SSD vanishes mid-recording). I learned this the hard way with several corrupted test recordings before switching to the official RPi5 PSU.
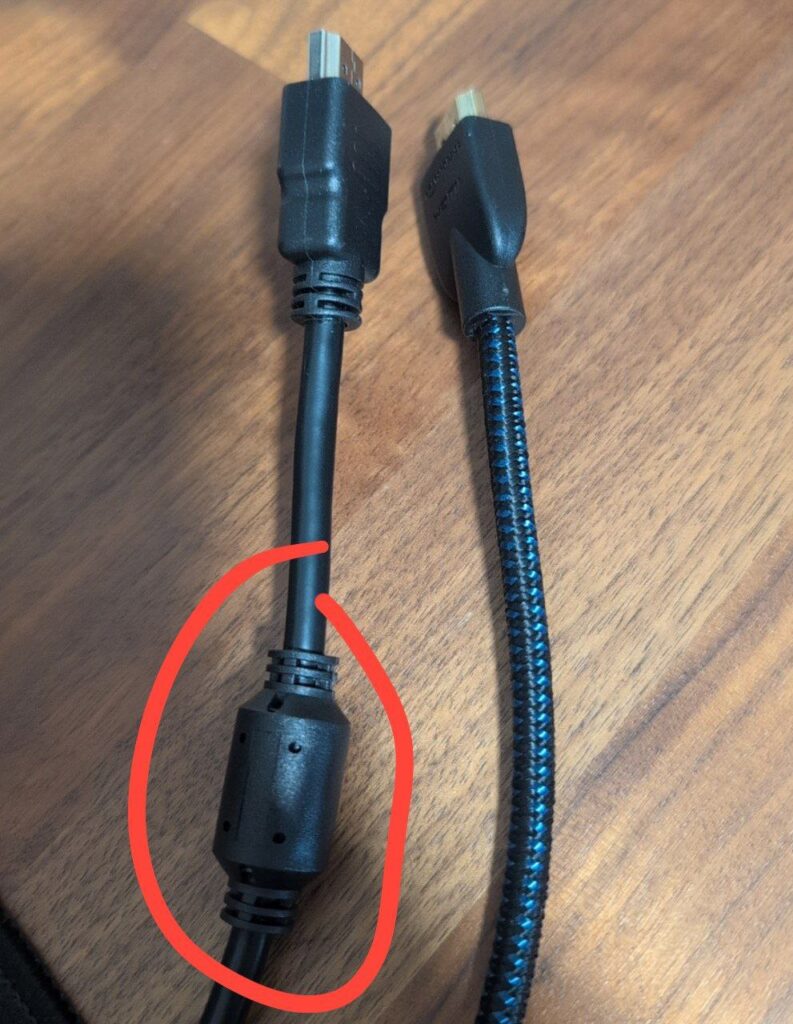
Some HDMI Cables Trigger the Power Warning
This one is sneaky. Certain bulky micro-HDMI adapters or cables with thick, moulded connectors draw enough current to trigger the Pi 5’s under-voltage warning, even with the official power supply. The symptom is the lightning bolt icon and vcgencmd get_throttled showing under-voltage events.
The fix is simple: use slim, short micro HDMI cables without bulky adapters. Before blaming your power supply, try swapping the HDMI cable.
YouTube Needs Cooldown Between Streams
If you stop a stream and restart it too quickly, YouTube accepts the connection but degrades the quality or drops it after a few minutes. Wait 1-2 minutes between stream sessions.
13. Cost Breakdown
Item
DIY Cost
Professional Alternative
One FITEBOX unit (core + cables)
~360€
–
Full production (+ webcam + mic + sound card)
~550€
–
5 units (full production, for 5 rooms)
~2.750€
10.000-25.000+ per event
Recurring cost per event
0€ (you own the hardware)
Full price again each year
The key insight for associations: you invest once, and every future event is free. The hardware survives year after year. The software is open-source and community-maintained. You control everything.
Compare this with hiring a recording crew at 2.000-5.000€+ per event, every year, with no ownership of the equipment and no ability to customise the output.
14. What’s Next
FITEBOX is production-ready and will be deployed at OpenSouthCode 2026 in Málaga. But there are things I want to improve:
Multi-box coordination – a central dashboard to monitor all FITEBOX units across all rooms from a single screen
Automated cloud uploads – push finished recordings to YouTube, PeerTube, or an archive server automatically after the event
Automated tests and CI/CD – the project has been tested manually on real hardware, but automated testing would help contributors
Better documentation – this blog post is a start, but the repository needs more inline documentation
Show timing on screen – produce visual information about how long the talk has been and how much time is left, showing information like “10 minutes left”, “5 minutes left” or “Last minute”.
Audio out control – let the soundcard output the composed audio to external speakers.
Lock Wifi QR on OLED – allow locking the OLED Wifi QR screen from the Web UI so it will pass this screen protecting the Wifi information to be leaked.
If you run a community conference, a hackerspace, a user group, or any association that records events, give FITEBOX a try. Clone the repo, build a box, and let me know how it goes. Pull requests are welcome.
15. Credits and Links
David Santos – designed the hardware architecture for the first FITEBOX prototype, selected the OLED display and button components, built the preliminary OLED controller software, and designed and 3D-printed the first physical enclosure (STL files). The hardware foundation of this project exists because of David’s work.
Juanmi Taboada – software development: recording engine, streaming pipeline, web interface, system manager, OLED controller v2+, CPU optimisation, and all the FFmpeg debugging that made production stability possible.
OpenSouthCode – the annual open-source conference in Málaga, where FITEBOX was conceived, built, and deployed. The need to record every room affordably and reliably is the reason this project exists.
This project was developed with assistance from AI coding tools (Claude by Anthropic and Gemini by Google) as pair-programming partners during the development process, and I spent too many hours cleaning the code they provided, testing the wrong solutions, adding types when missing, refactoring algorithms and structures to provide sense and stability behind the craziness of AI.
FITEBOX – because every talk deserves to be recorded, and no community should go broke doing it.
🐰🐇🐰🐇🐰🐇🐰🐇🐰🐇🐰🐇🐰🐇🐰🐇🐰🐇🐰🐇🐰🐇🐰🐇🐰🐇🐰🐇🐰🐇🐰🐇🐰🐇🐰
🐰🐇 EASTER EGG 🐇🐰
The name FITEBOX is a tribute to the project’s roots in Málaga, Spain, blending local culture with technical purpose:
FITE: Derived from the popular Malagueño expression “¡Fite tú!” (short for “Fíjate tú”). It translates roughly to “Check this out!” or “Look at that!”. It represents the “wow” factor of having a fully autonomous recording solution at your fingertips. It highlights the device’s impressive capabilities.
BOX: Inspired by the Boombox, the iconic portable radio-recorders that dominated 80s hip-hop culture. Just like the original boomboxes brought recording and playback to the streets, FITEBOX brings professional conference recording to a portable, autonomous “box” format.
In short: It’s the “Check-this-out Box”, a smart, local, and powerful way to capture conference content without the headache.
Examples of how to work with JSON, YAML, CSV, and XML files in Python. Today I saw myself preparing some exercises for my student who is learning Python programming language, and last week he asked me about converting a CSV to XML. So I decided to publish these exercises for anybody who doubts how to […]
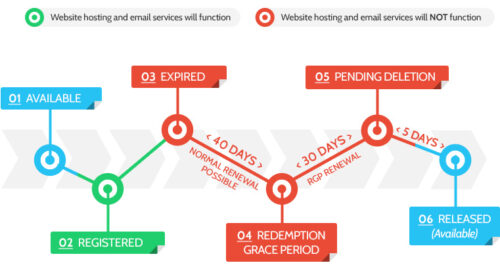
En este artículo hablamos del ciclo de vida de un dominio. El nombre de dominio está registrado o renovado. Los nombres de dominio pueden estar registrados o renovados por un período de 1-10 años de tal manera que no atraviesen el período máximo permitido desde la fecha de registro o renovación. El nombre de dominio caduca, comienzo del […]